it doesnt support AVX2 so it crashes. You wouldnt get much benefit without AVX2 anyway.I tried your latest patch 9 but it's crashing on my really old CPU (i7-3770K) during opening the benchmark.
Error log:
-
Hi Guest!
We have posted a new VaM2 dev log on Patreon, starting a monthly cadence of written progress updates between Beta releases. Highlights include the new Gizmos System, Selection Carousel, and Modes System with Context-Specific Editing. Beta1.2 is 15 of 21 items complete.
Read the full post on Patreon, or follow progress on the public Trello roadmap.
You are using an out of date browser. It may not display this or other websites correctly.
You should upgrade or use an alternative browser.
You should upgrade or use an alternative browser.
Performance Patch (up to 30% more physics speed)
- Thread starter turtlebackgoofy
- Start date
Please atleast fix the unneeded decompression bug without loading the full zip, it's just 2 lines. I proposed one adjustment and one fix, please do the small fix.I think the best path is probably you keep developing this and work out the kinks, and possibly at some future point I can roll into application if you are willing to let me do that. If not, it can live on as a side patch.
Seriously great work and I'm very impressed!
Last edited:
Please atleast fix the unneeded decompression bug without loading the full zip, it's just 2 lines. I proposed one adjustment and one fix, please do the small fix.
I'll try. I have another pending request from another user I would like to put in as well.
Knowing this is how the zip reader works, I'm tempted to review the rest of the binary reads I do. But I suppose the worst offender is the morphs since there can be a lot of them.
they also happen in fancy strip scenes when the animation gets loaded while the scene runs, noticeable in a short stutteringI'll try. I have another pending request from another user I would like to put in as well.
Knowing this is how the zip reader works, I'm tempted to review the rest of the binary reads I do. But I suppose the worst offender is the morphs since there can be a lot of them.
Amazing work! I'm seeing noticeable improvement in loading as well as FPS.
@meshedvr
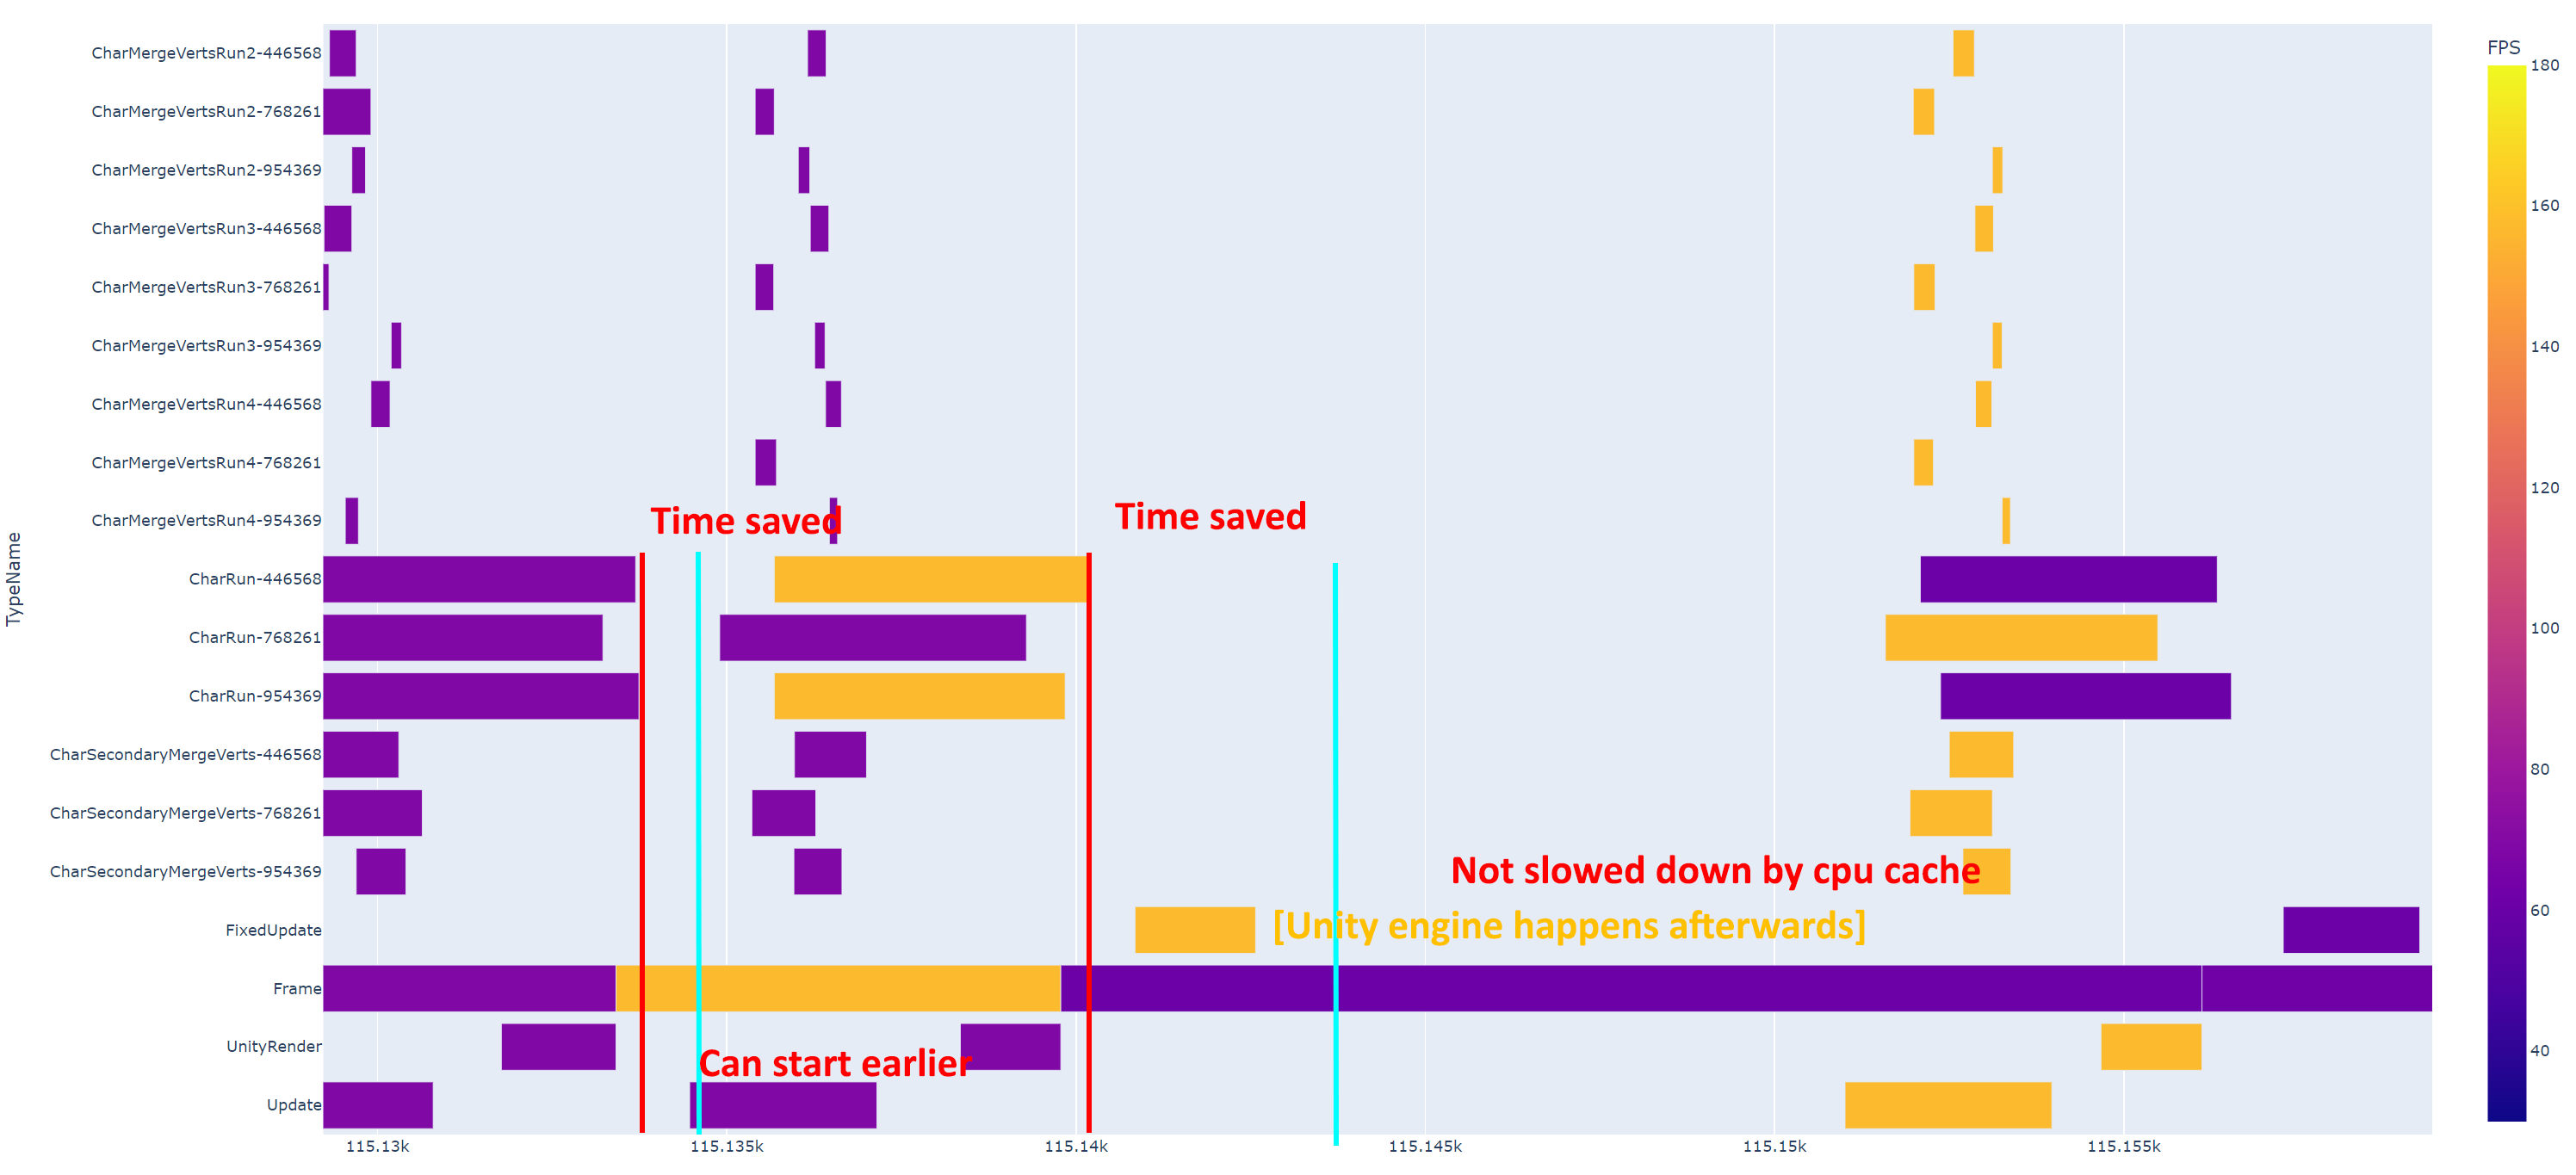
(The "time saved" distance is just for illustration, it was about 20% of the CharRun)
Here are the two points where the optimization for SkinMeshPart works:
If your FPS is already much higher than physics rate, the performance patch is immediately noticeable. Since there are multiple frames in between FixedUpdate that profit directly from a faster finishing CharacterRun thread. This is where the main FPS gain comes from, the FPS inbetween FixedUpdate is directly boosted.
If your FPS matches physics rate closely or is below it, you get a FixedUpdate on every frame and in theory it shouldnt matter if the CharacterRun thread runs while FixedUpdate and the unity engine happens. However without the patch the FixedUpdate and unity engine will be slowed down because the CharacterRun thread also consumes a lot of RAM bandwidth while it still runs in parallel. This effect however is slim.
So in short: if your physics rate is 60hz and your FPS is 60, you barely notice any change in FPS with my patch. But once you crank in another frame inbetween physics updates, the FPS starts to grow.
The other point is my optimization for ComputeColliders, that one is simply shortening FixedUpdate itself, which is just more FPS in frames where a FixedUpdate happens.
I will add an optional performance profiling option to my patch so other users can share their data for analysis.
I will also experiment a little with core schedueling, something tells me I can make the Unity Engine a lot faster if I fix it on the cores.
The data was gathered via the DLL and saved to a .csv which I then plotted with python.
You can even see how horrible the Unity GC is (Newest Unity should have a better one afaik)
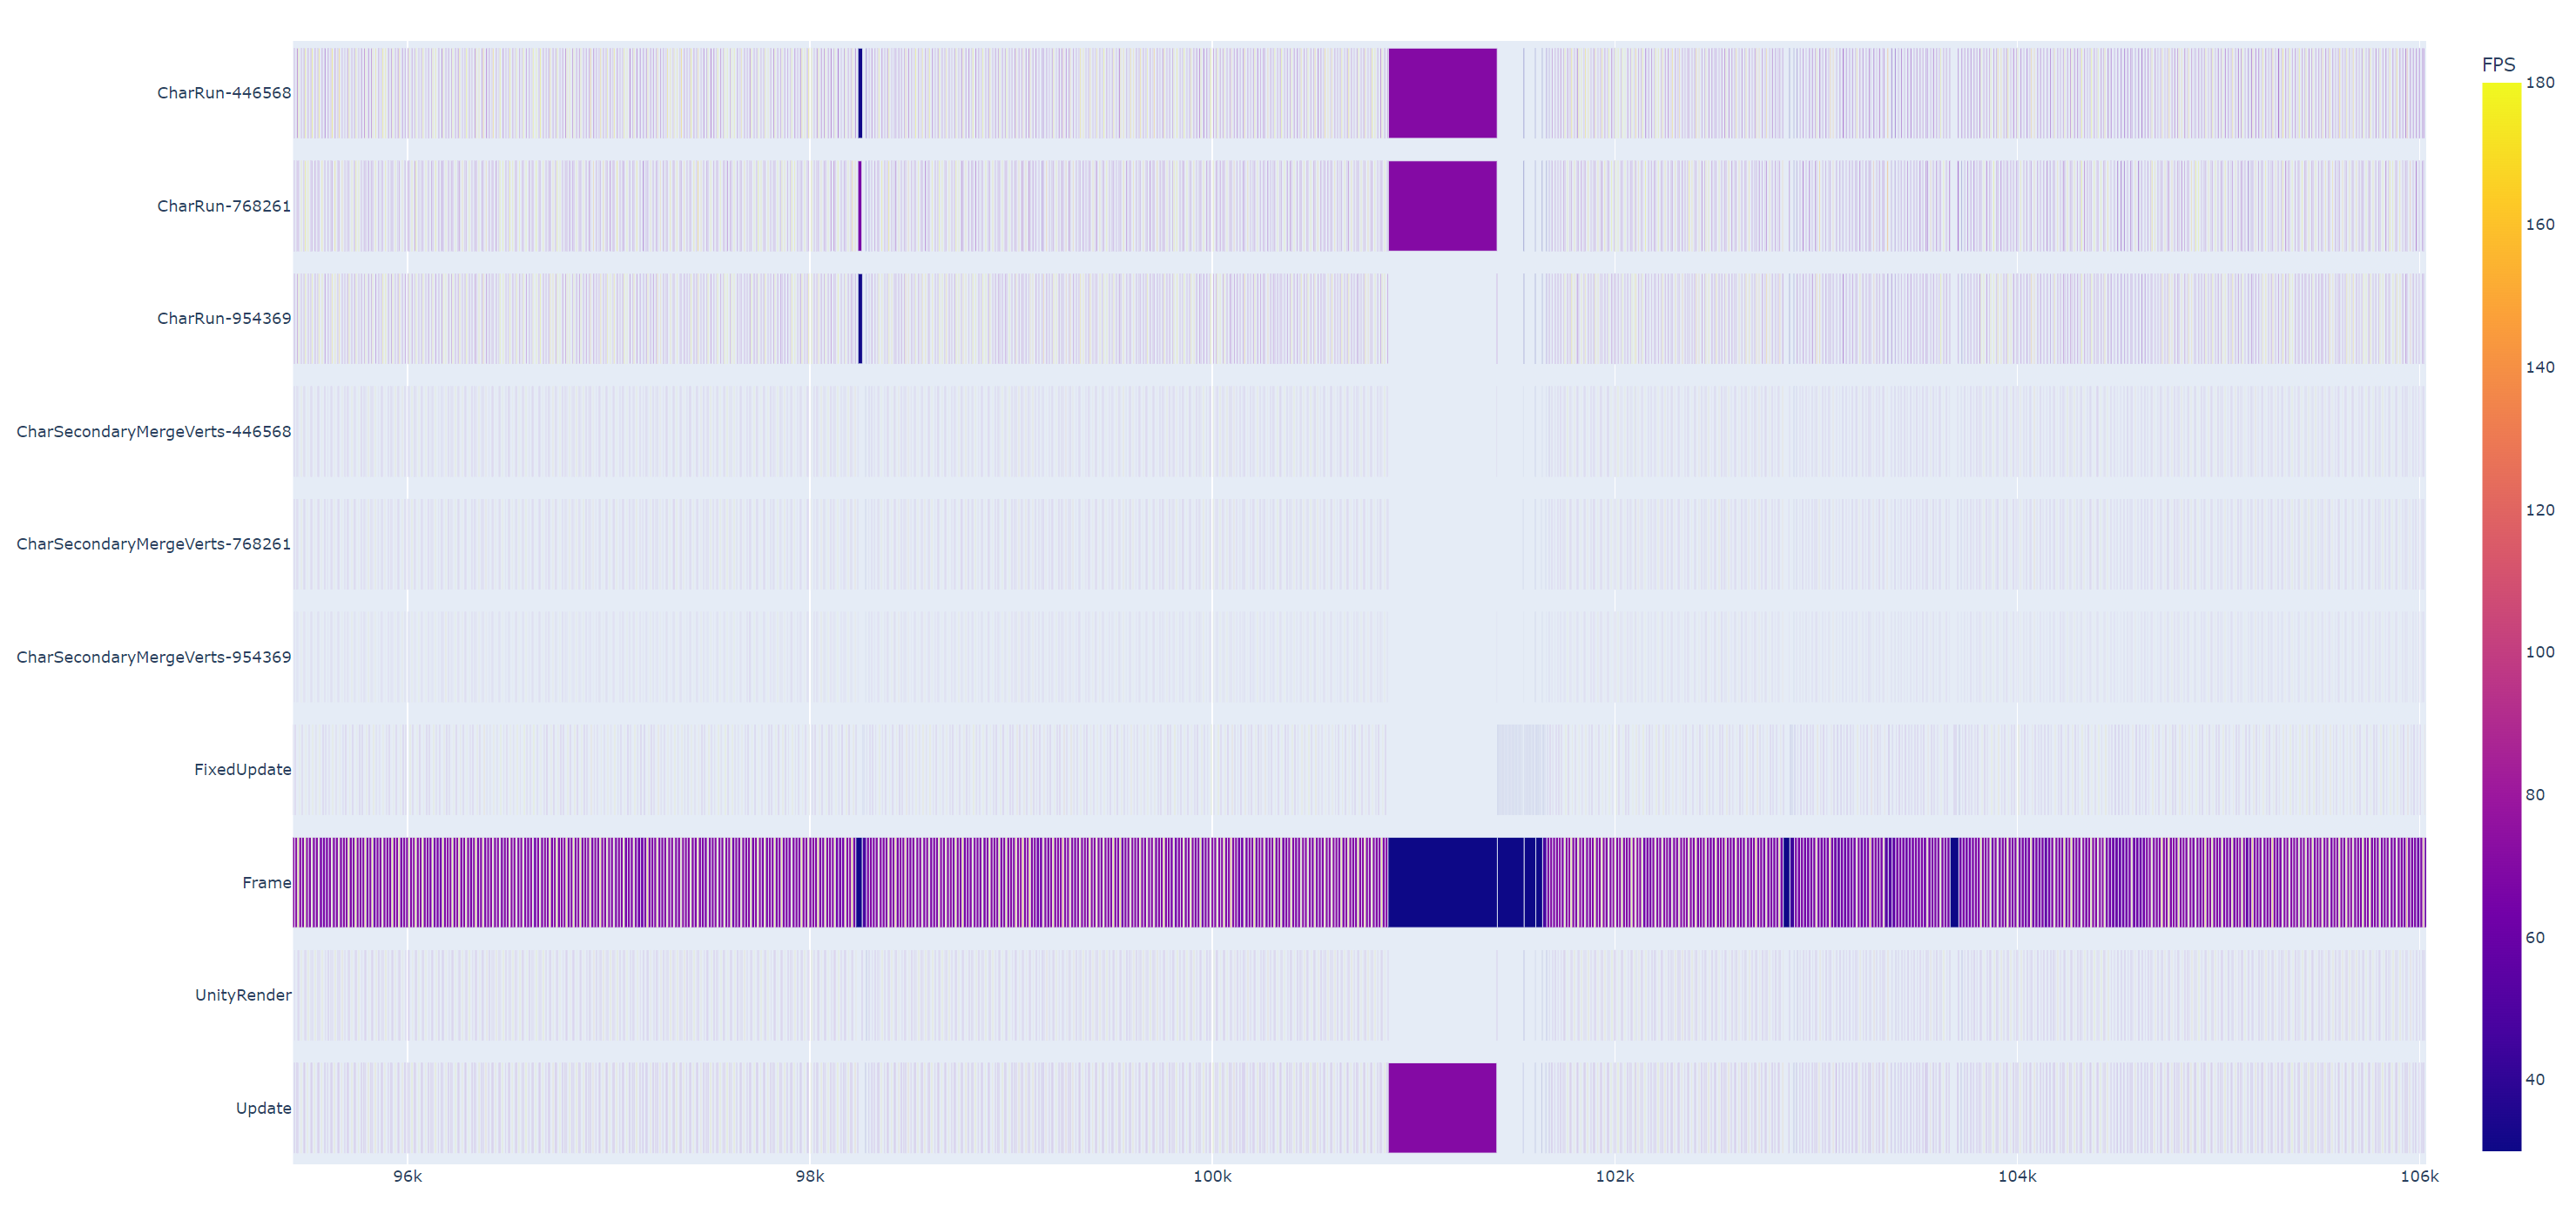
Maybe only letting GC run at certain times will fix those 500ms lag spikes...
(The "time saved" distance is just for illustration, it was about 20% of the CharRun)
Here are the two points where the optimization for SkinMeshPart works:
If your FPS is already much higher than physics rate, the performance patch is immediately noticeable. Since there are multiple frames in between FixedUpdate that profit directly from a faster finishing CharacterRun thread. This is where the main FPS gain comes from, the FPS inbetween FixedUpdate is directly boosted.
If your FPS matches physics rate closely or is below it, you get a FixedUpdate on every frame and in theory it shouldnt matter if the CharacterRun thread runs while FixedUpdate and the unity engine happens. However without the patch the FixedUpdate and unity engine will be slowed down because the CharacterRun thread also consumes a lot of RAM bandwidth while it still runs in parallel. This effect however is slim.
So in short: if your physics rate is 60hz and your FPS is 60, you barely notice any change in FPS with my patch. But once you crank in another frame inbetween physics updates, the FPS starts to grow.
The other point is my optimization for ComputeColliders, that one is simply shortening FixedUpdate itself, which is just more FPS in frames where a FixedUpdate happens.
I will add an optional performance profiling option to my patch so other users can share their data for analysis.
I will also experiment a little with core schedueling, something tells me I can make the Unity Engine a lot faster if I fix it on the cores.
The data was gathered via the DLL and saved to a .csv which I then plotted with python.
You can even see how horrible the Unity GC is (Newest Unity should have a better one afaik)
Maybe only letting GC run at certain times will fix those 500ms lag spikes...
Last edited:
New version submitted and awaiting mod approval.
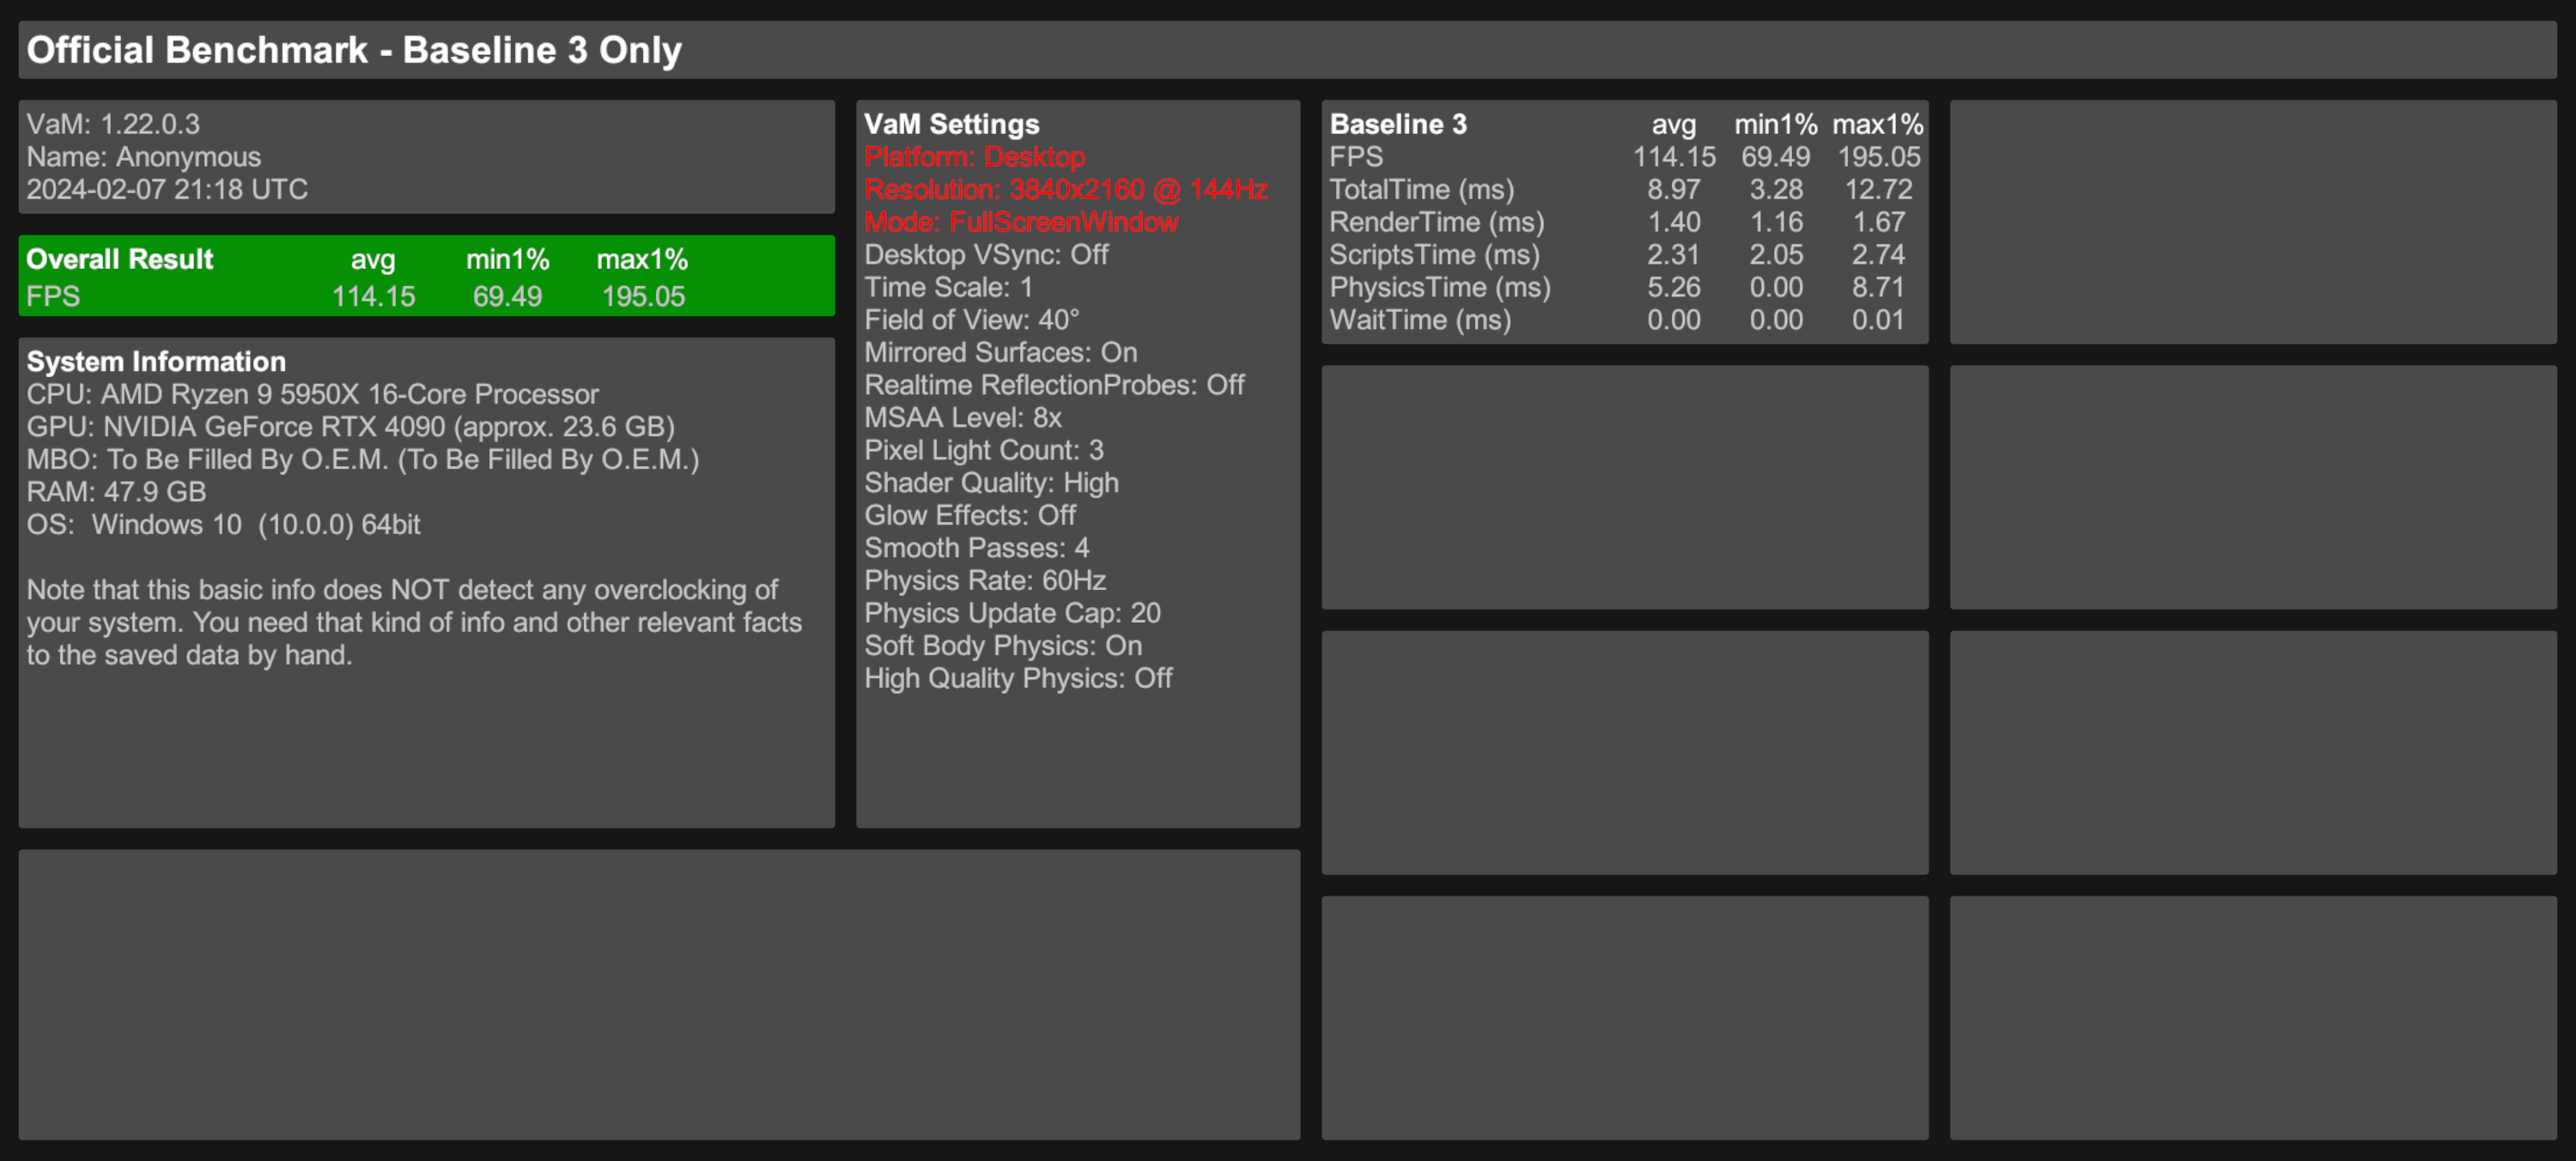
At first i thought something went really, really wrong for intel this time.
V10 - HT Disabled - Suggested config from the resource page
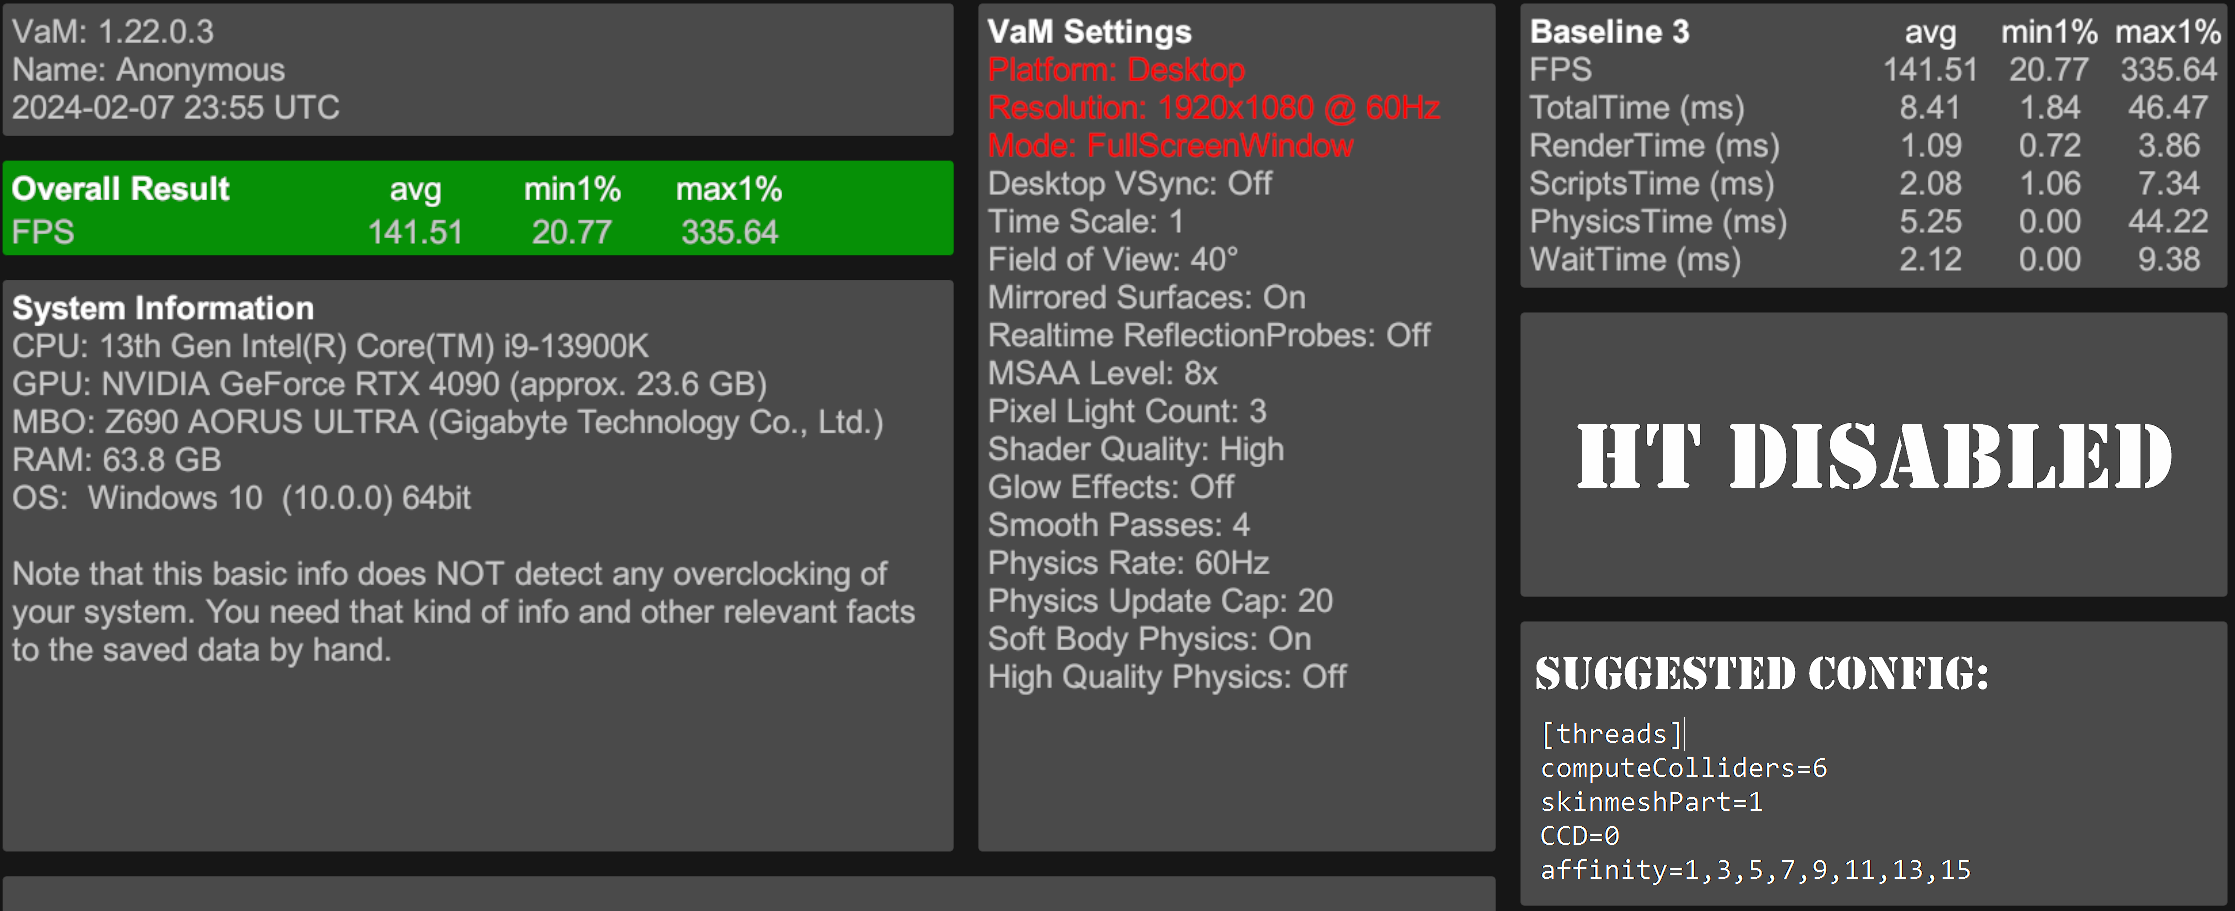
So i started the test 2nd time:
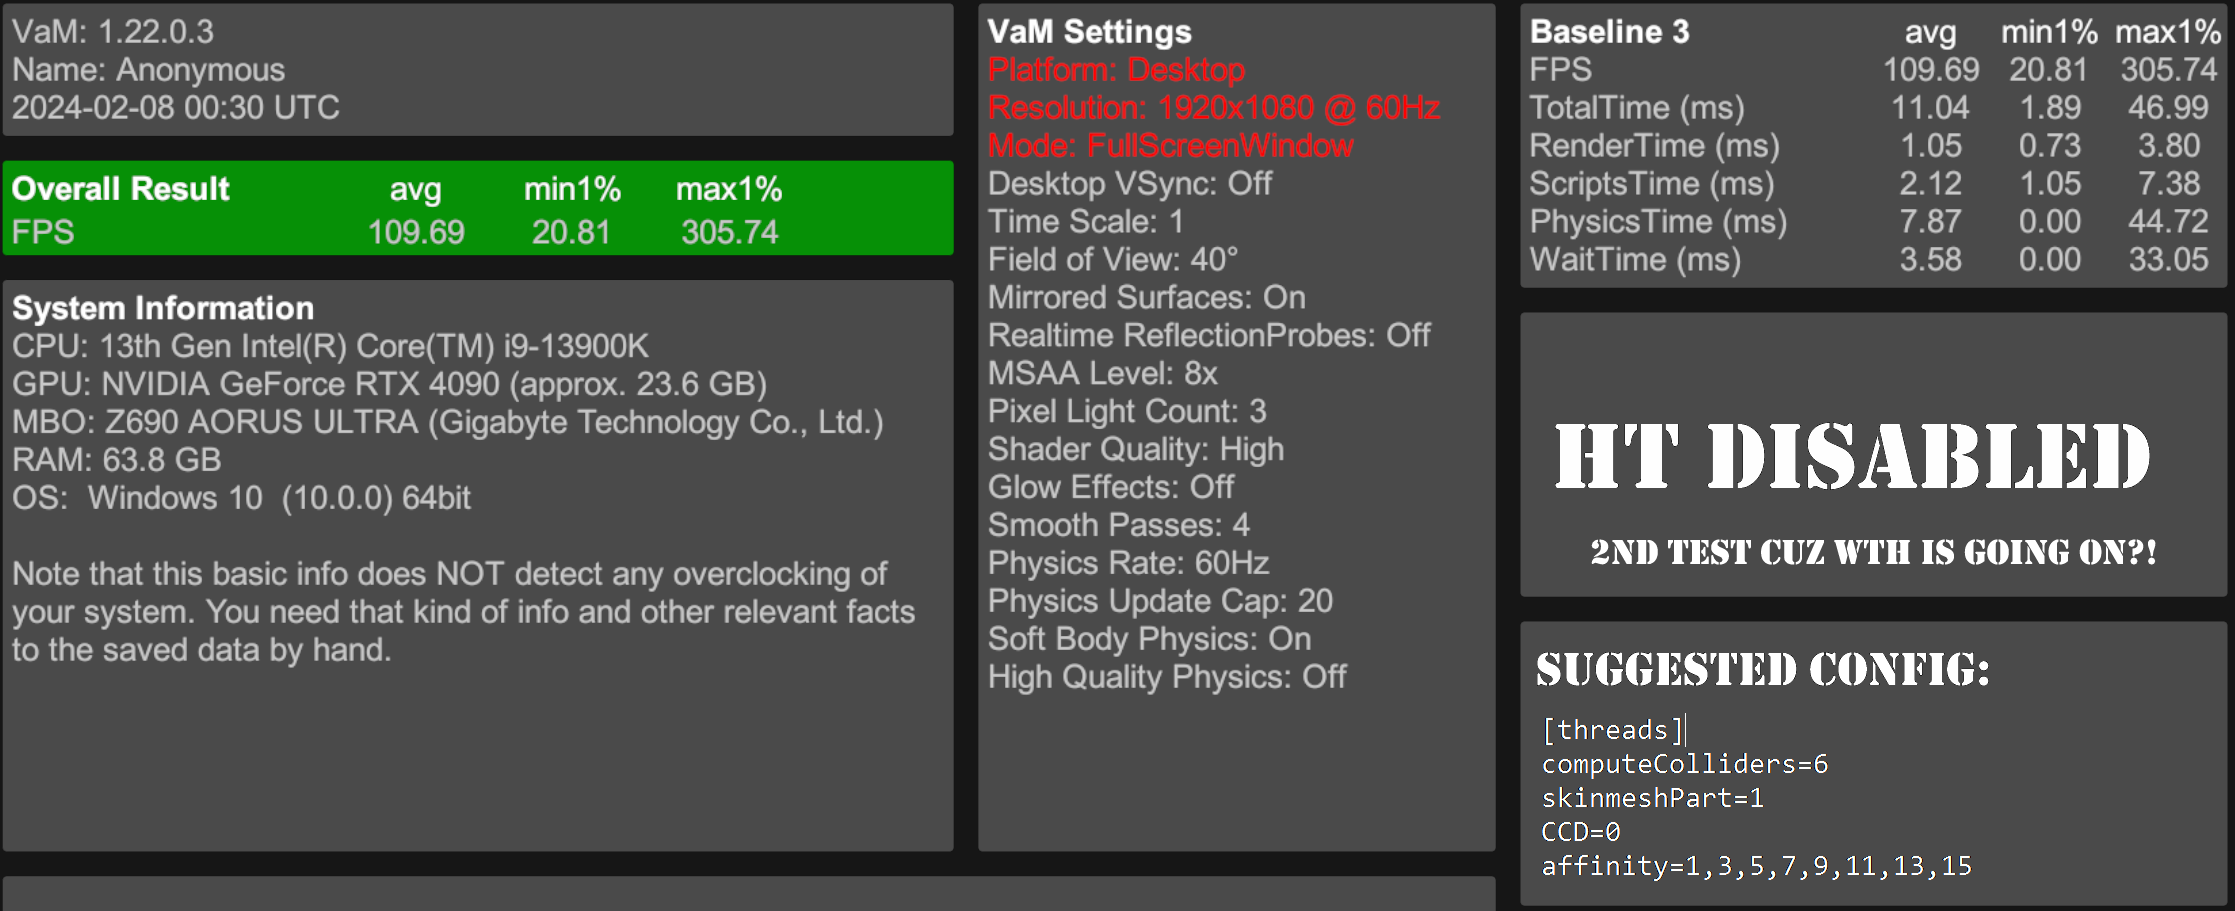
So... it was terrible, like 5 times worse than base game QQ
So i copied my own config i been using:
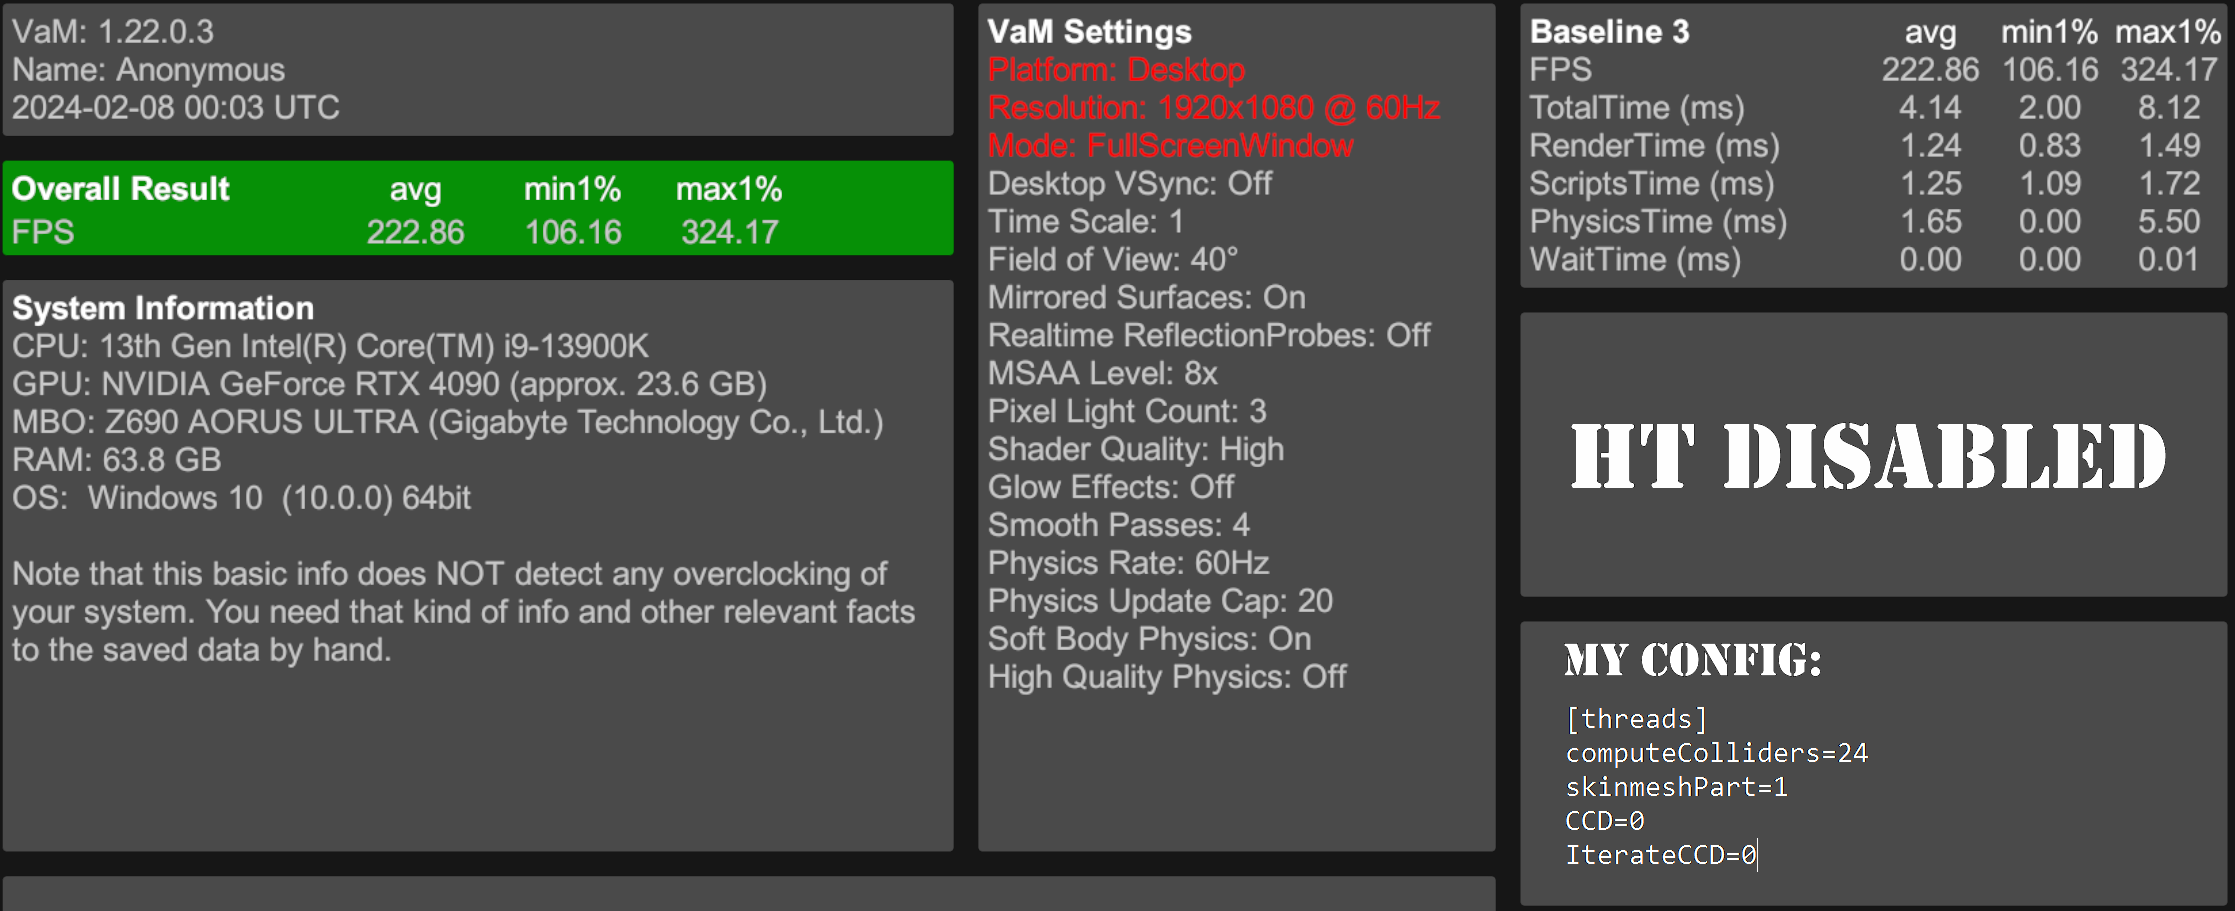
Better, but not even close to my previous results.
So...
Let's try to turn on HT:
V10 - HT Enabled - My settings
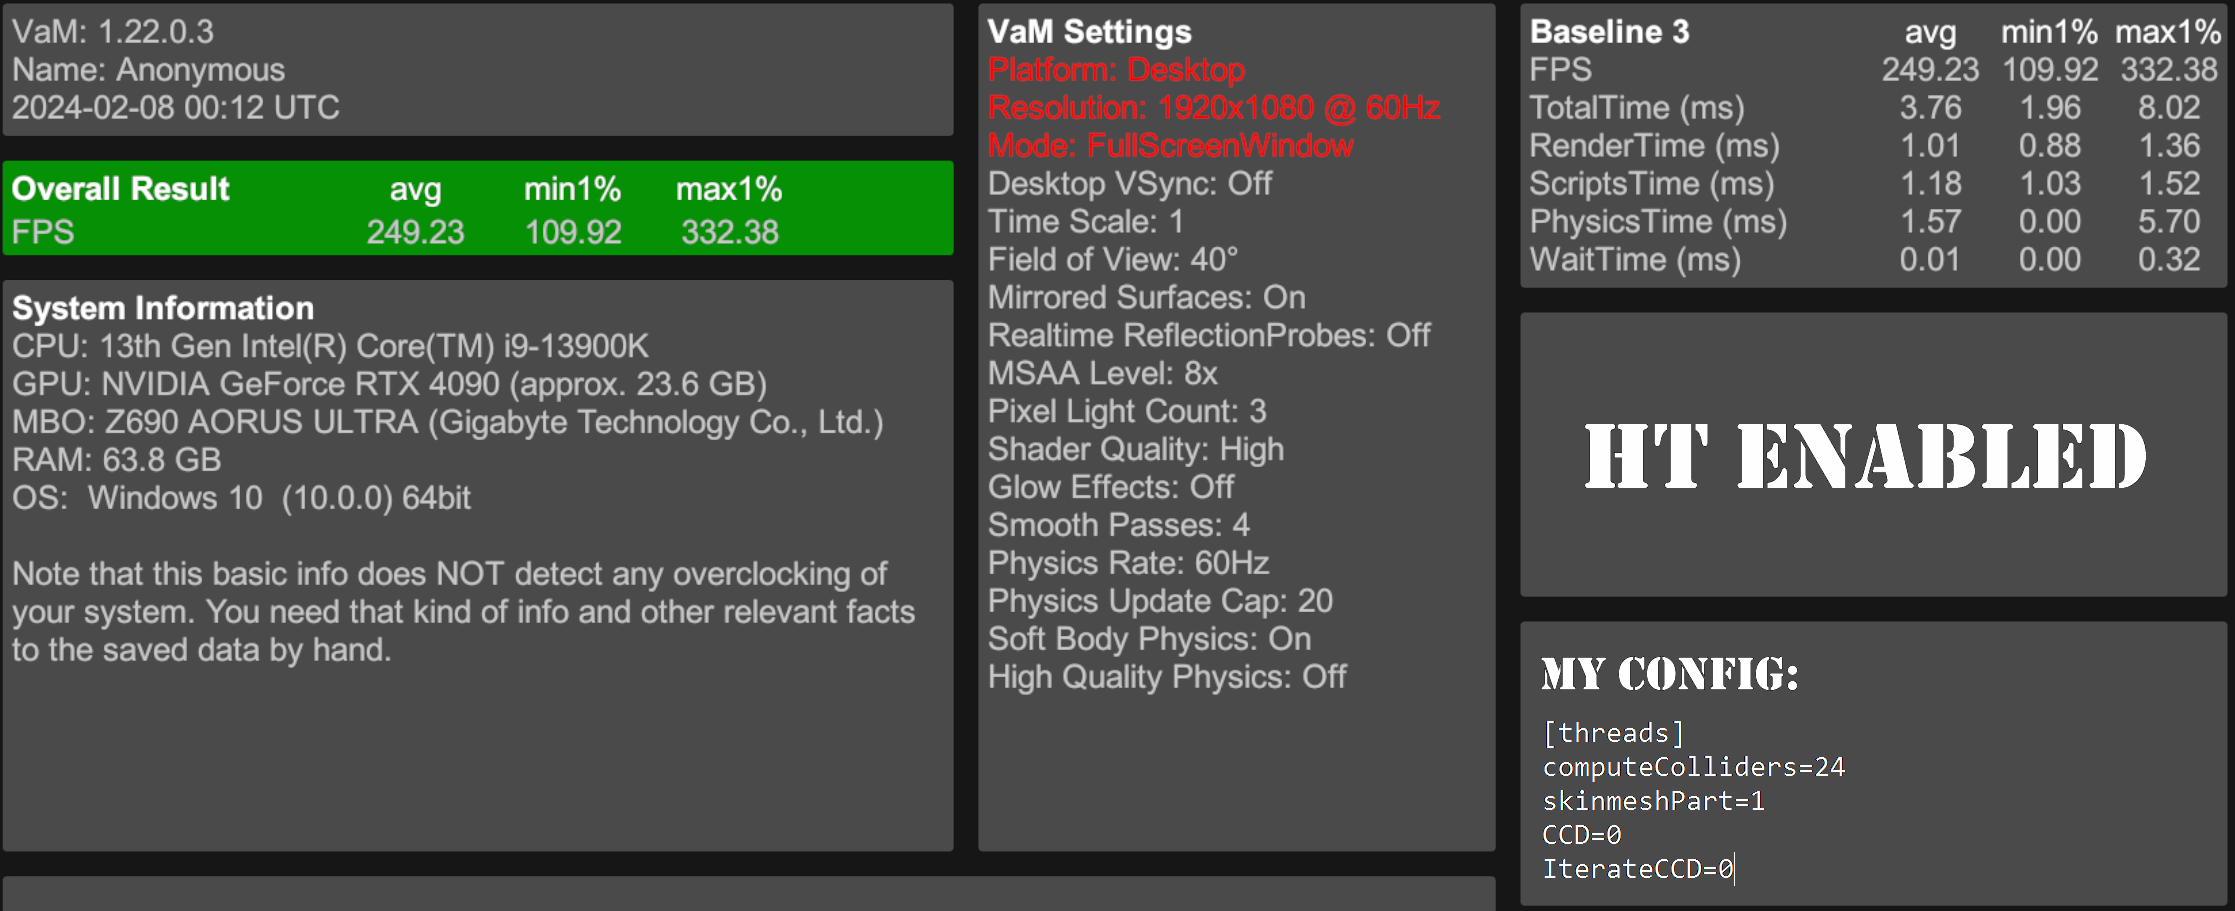
Better, but still missing something.
Maybe suggested settings?
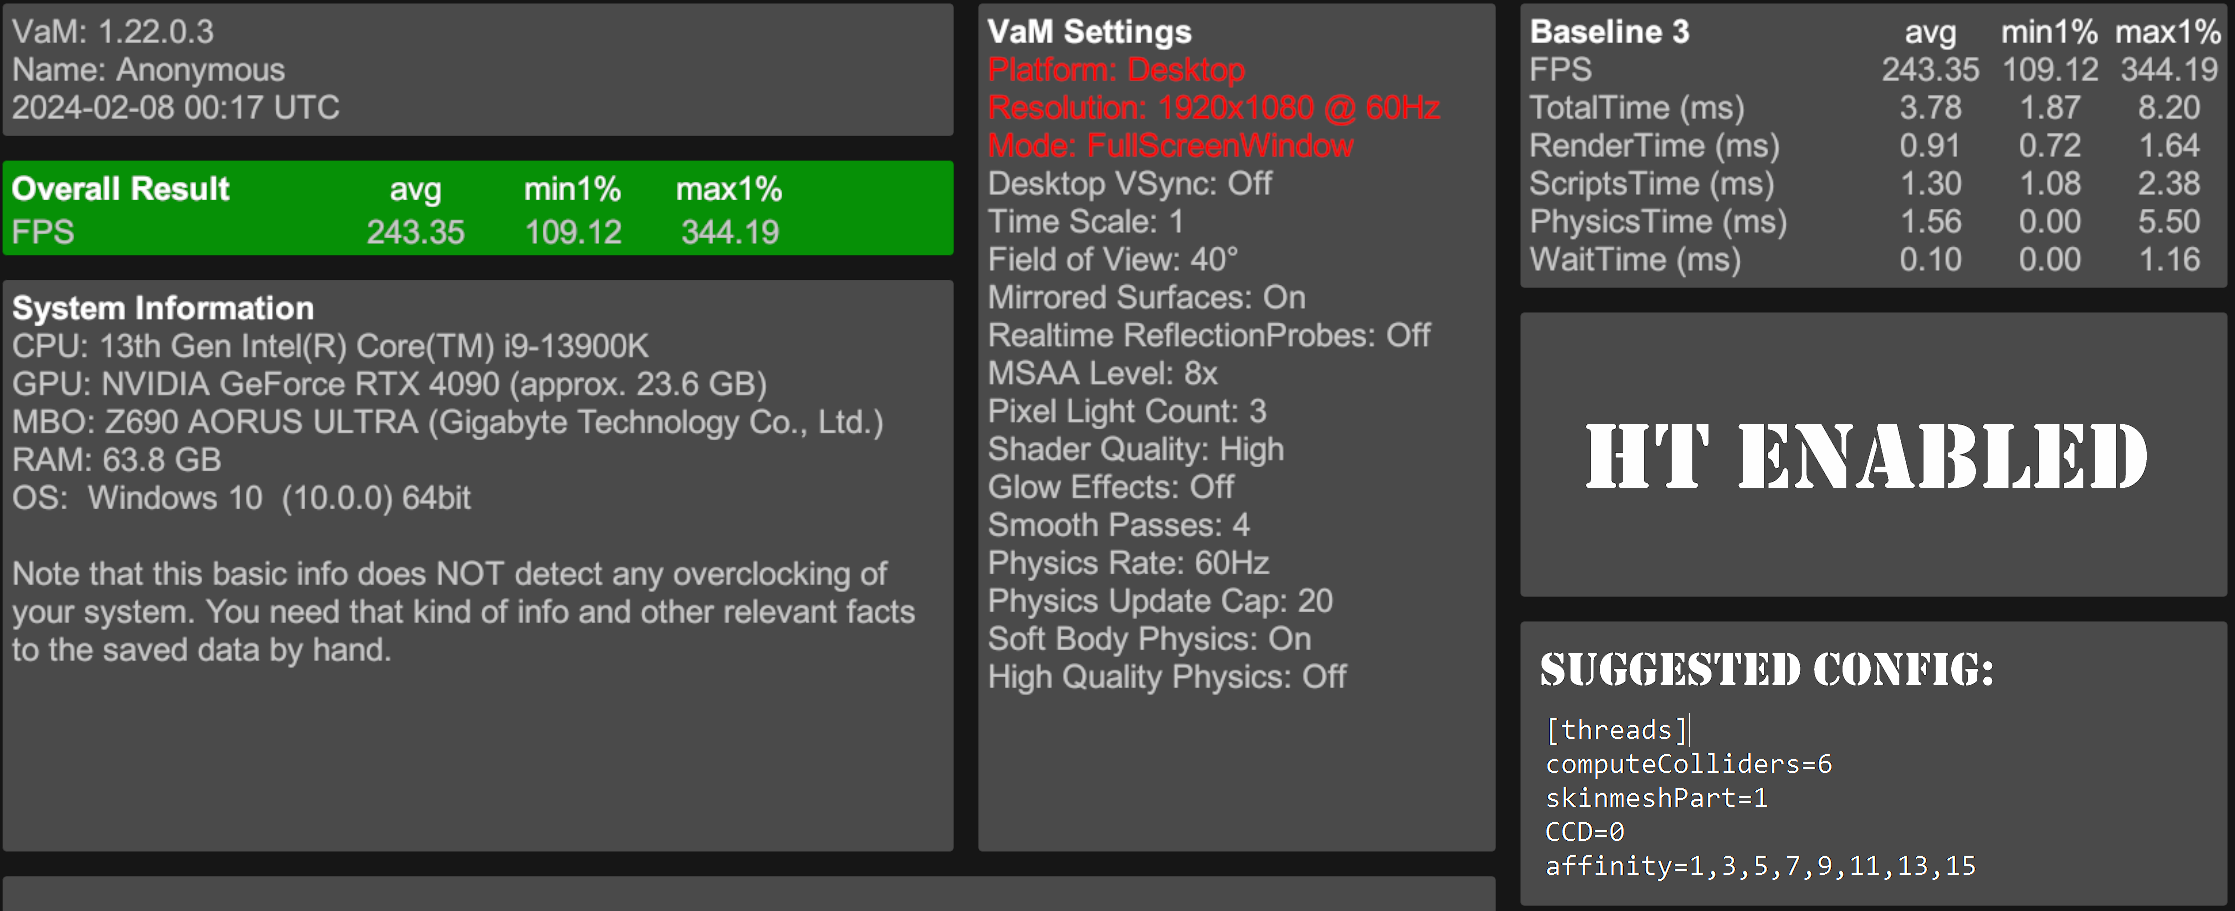
Still not quite...
Rolling back to 9 fix 3.
9 fix 3 - HT Enabled - Suggested config:
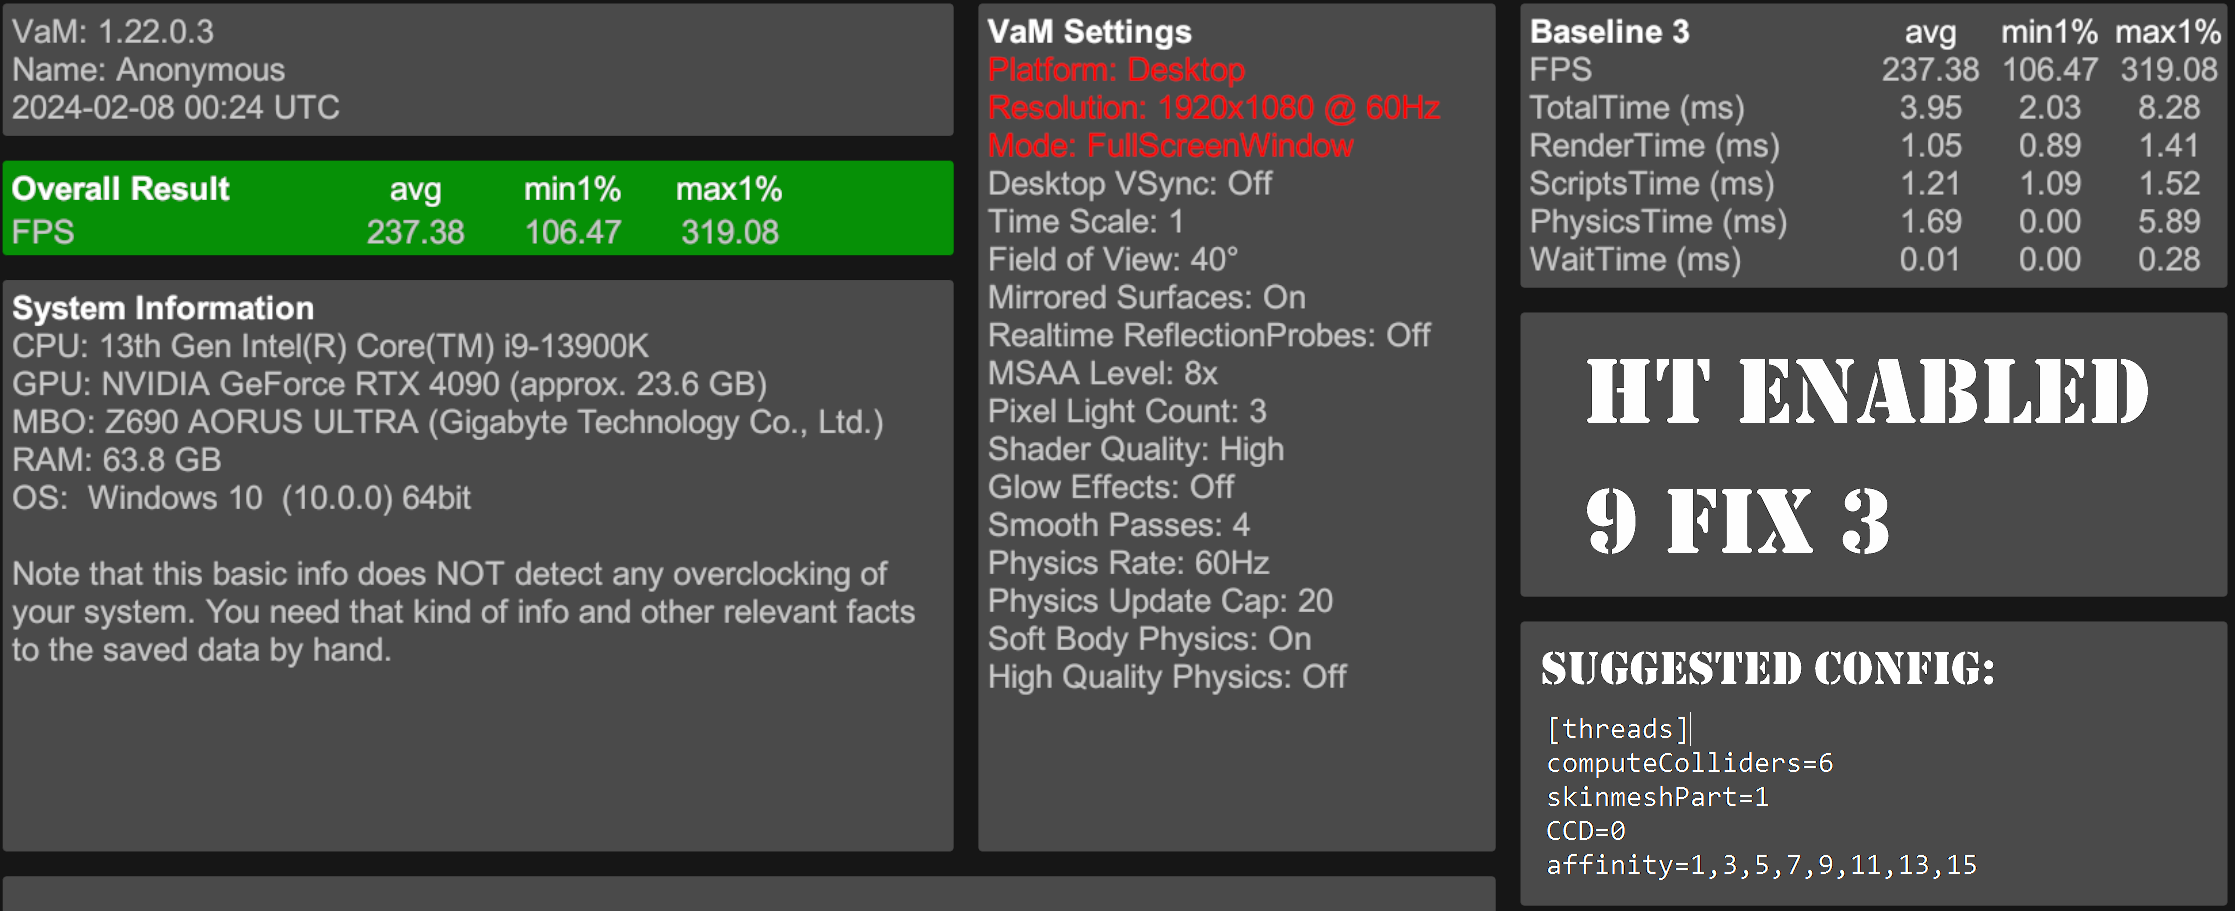
Uh...
Maybe my own?
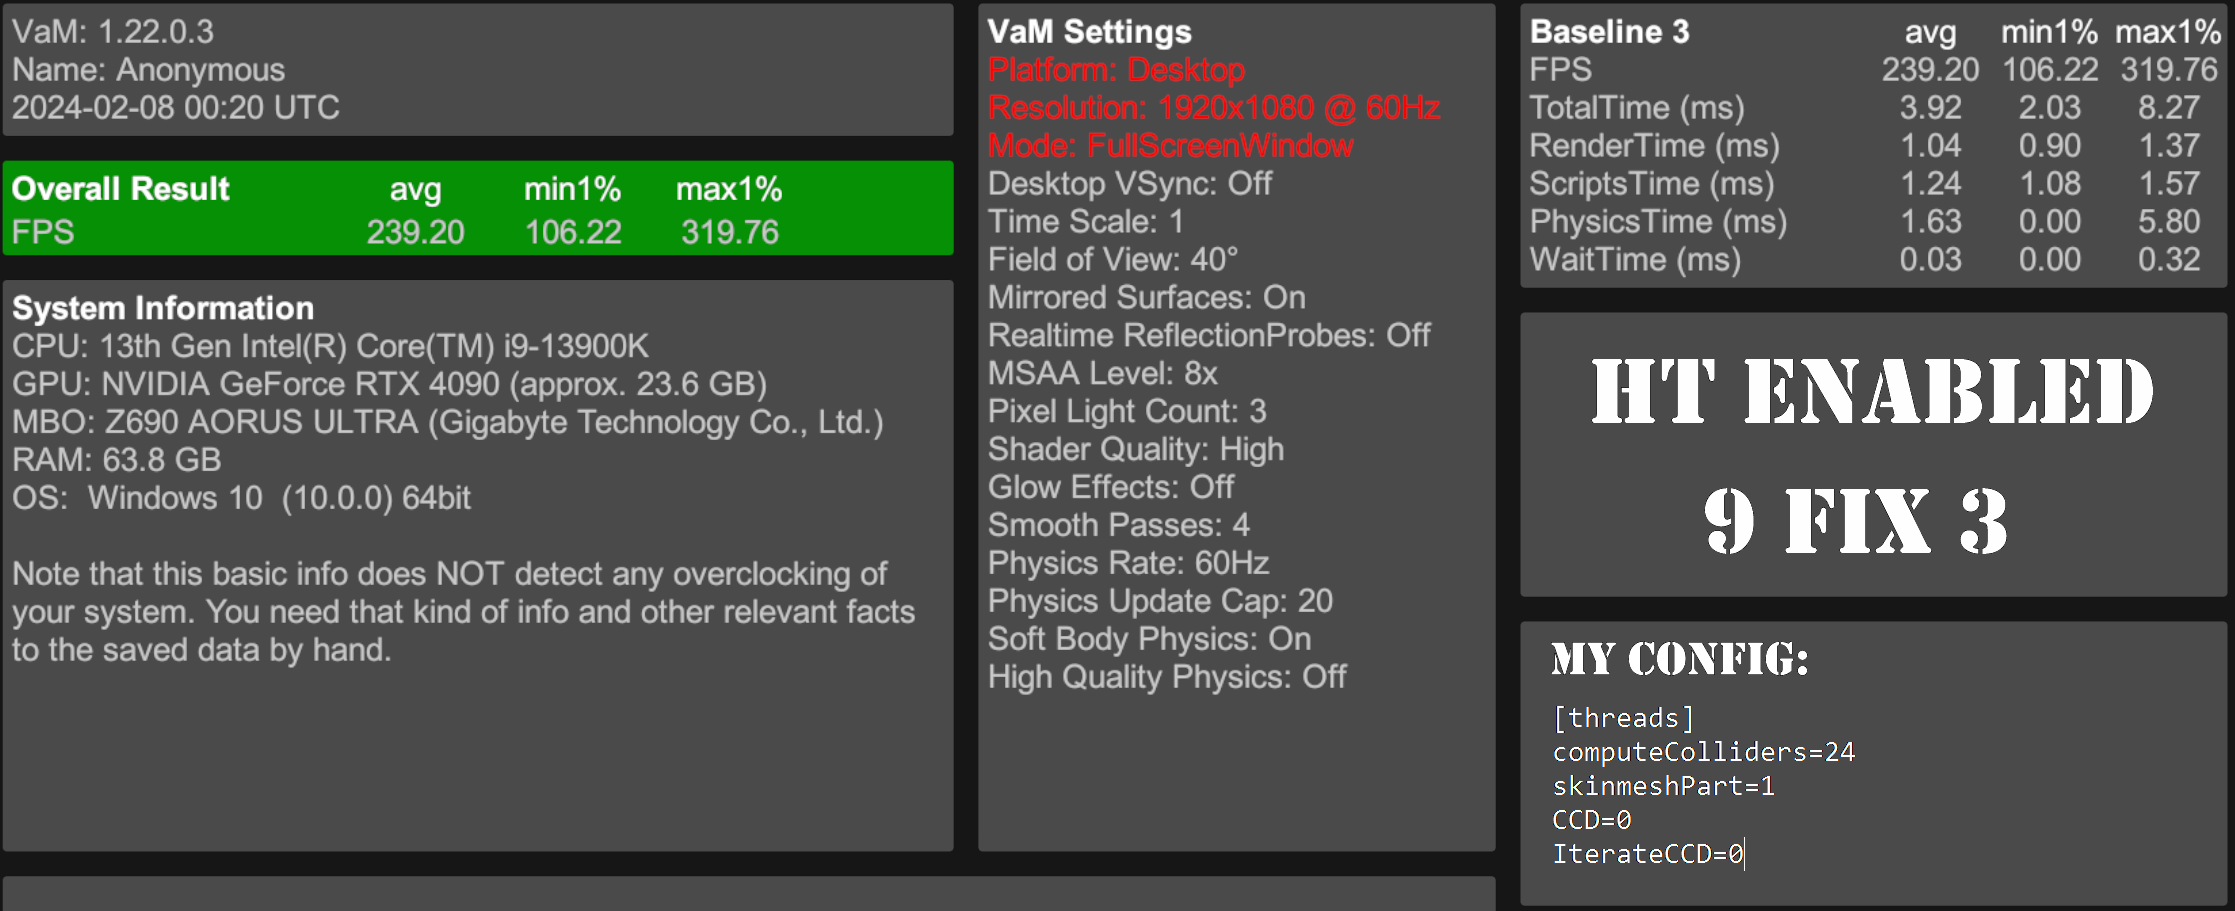
Still bad.
Disabling HT.
9 fix 3 - HT disabled - My settings:
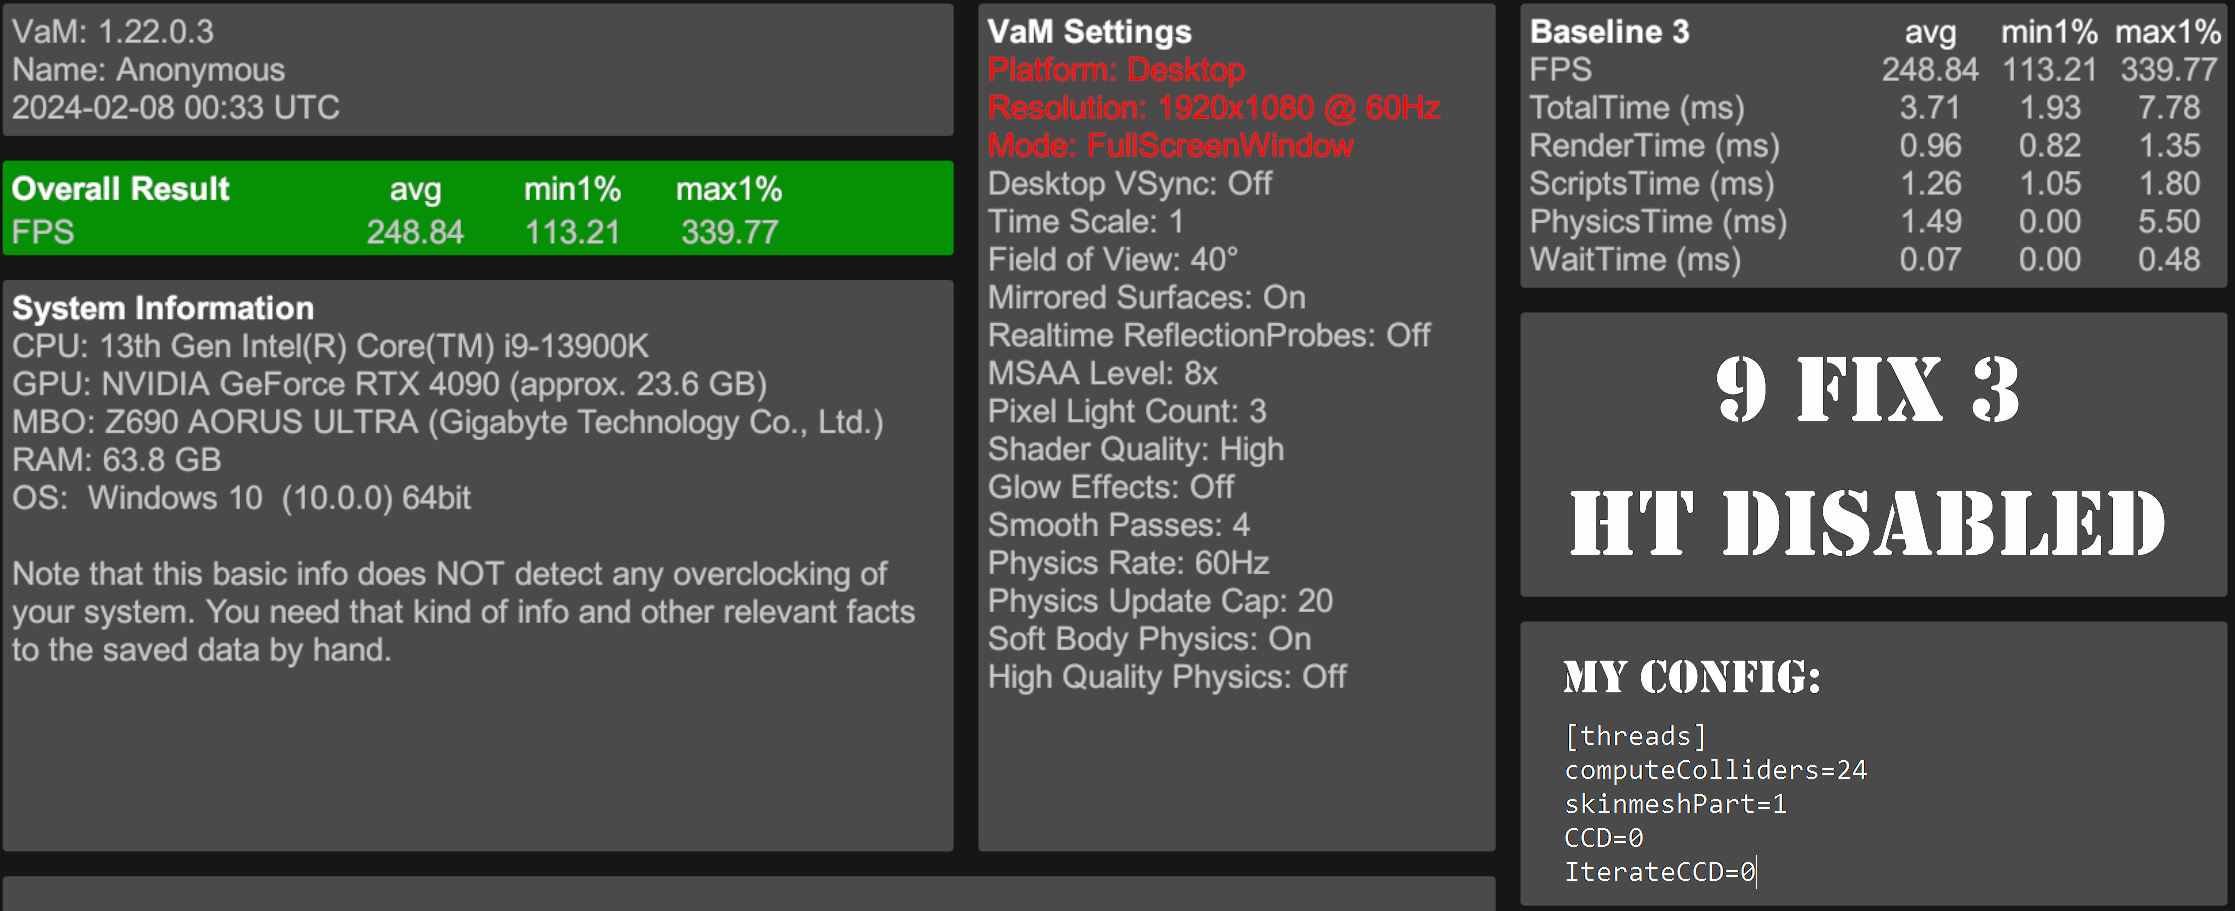
Yup, thats works.
So.. For intel users... If you gonna update the patch to v10 make sure to ENABLE HT in the bios.
Also, it seems previous version is somehow faster for us [stock cpu settings no cores tuned anyhow, with just HT turned off]
V10 - HT Disabled - Suggested config from the resource page
So i started the test 2nd time:
So... it was terrible, like 5 times worse than base game QQ
So i copied my own config i been using:
Better, but not even close to my previous results.
So...
Let's try to turn on HT:
V10 - HT Enabled - My settings
Better, but still missing something.
Maybe suggested settings?
Still not quite...
Rolling back to 9 fix 3.
9 fix 3 - HT Enabled - Suggested config:
Uh...
Maybe my own?
Still bad.
Disabling HT.
9 fix 3 - HT disabled - My settings:
Yup, thats works.
So.. For intel users... If you gonna update the patch to v10 make sure to ENABLE HT in the bios.
Also, it seems previous version is somehow faster for us [stock cpu settings no cores tuned anyhow, with just HT turned off]
Here is how the cores are numbered with and without HT enabled in BIOS:At first i thought something went really, really wrong for intel this time.
V10 - HT Disabled - Suggested config from the resource page
View attachment 332634
So i started the test 2nd time:
View attachment 332635
So... it was terrible, like 5 times worse than base game QQ
So i copied my own config i been using:
View attachment 332636
Better, but not even close to my previous results.
So...
Let's try to turn on HT:
V10 - HT Enabled - My settings
View attachment 332637
Better, but still missing something.
Maybe suggested settings?
View attachment 332638
Still not quite...
Rolling back to 9 fix 3.
9 fix 3 - HT Enabled - Suggested config:
View attachment 332639
Uh...
Maybe my own?
View attachment 332640
Still bad.
Disabling HT.
9 fix 3 - HT disabled - My settings:
View attachment 332641
Yup, thats works.
So.. For intel users... If you gonna update the patch to v10 make sure to ENABLE HT in the bios.
Also, it seems previous version is somehow faster for us [stock cpu settings no cores tuned anyhow, with just HT turned off]
HT enabled in BIOS:
Core1 - real
Core2 - HT core
Core3 - real
Core4 - HT core
and so on...
which means
affinity=1,3,5,7,9,...
HT disabled in BIOS:
Core1 - real
Core2 - real
Core3 - real
and so on...
which means
affinity=1,2,3,4,5,6,...
My theory was to run VaM on all REAL cores and skip the HT cores.
That worked best on my AMD. Could you please try the v10 and these configs?
HT enabled in BIOS:
Code:
[threads]
computeColliders=6
skinmeshPart=1
affinity=1,3,5,7,9,11,13,15
HT enabled in BIOS:
Code:
[threads]
computeColliders=12
skinmeshPart=1
affinity=1,2,3,4,5,6,7,8,9,10,11,12,13,14,15,16
HT enabled in BIOS:
Code:
[threads]
computeColliders=18
skinmeshPart=1
affinity=1,2,3,4,5,6,7,8,9,10,11,12,13,14,15,16,17,18,19,20,21,22,23,24
HT enabled in BIOS:
Code:
[threads]
computeColliders=24
skinmeshPart=1
affinity=1,2,3,4,5,6,7,8,9,10,11,12,13,14,15,16,17,18,19,20,21,22,23,24
HT enabled in BIOS:
Code:
[threads]
computeColliders=24
skinmeshPart=1
affinity=1,2,3,4,5,6,7,8,9,10,11,12,13,14,15,16,17,18,19,20,21,22,23,24,25,26,27,28,29,30,31,32
HT enabled in BIOS:
Code:
[threads]
computeColliders=32
skinmeshPart=1
affinity=1,2,3,4,5,6,7,8,9,10,11,12,13,14,15,16,17,18,19,20,21,22,23,24,25,26,27,28,29,30,31,32
I wanna find out how exactly those "efficient cores" are connected.
Sorry, i won't be able to run these many tests at the moment, at least for the next 48 hours.Here is how the cores are numbered with and without HT enabled in BIOS:
HT enabled in BIOS:
Core1 - real
Core2 - HT core
Core3 - real
Core4 - HT core
and so on...
which means
affinity=1,3,5,7,9,...
HT disabled in BIOS:
Core1 - real
Core2 - real
Core3 - real
and so on...
which means
affinity=1,2,3,4,5,6,...
My theory was to run VaM on all REAL cores and skip the HT cores.
That worked best on my AMD. Could you please try the v10 and these configs?
HT enabled in BIOS:
Code:[threads] computeColliders=6 skinmeshPart=1 affinity=1,3,5,7,9,11,13,15
HT enabled in BIOS:
Code:[threads] computeColliders=12 skinmeshPart=1 affinity=1,2,3,4,5,6,7,8,9,10,11,12,13,14,15,16
HT enabled in BIOS:
Code:[threads] computeColliders=18 skinmeshPart=1 affinity=1,2,3,4,5,6,7,8,9,10,11,12,13,14,15,16,17,18,19,20,21,22,23,24
HT enabled in BIOS:
Code:[threads] computeColliders=24 skinmeshPart=1 affinity=1,2,3,4,5,6,7,8,9,10,11,12,13,14,15,16,17,18,19,20,21,22,23,24
HT enabled in BIOS:
Code:[threads] computeColliders=24 skinmeshPart=1 affinity=1,2,3,4,5,6,7,8,9,10,11,12,13,14,15,16,17,18,19,20,21,22,23,24,25,26,27,28,29,30,31,32
HT enabled in BIOS:
Code:[threads] computeColliders=32 skinmeshPart=1 affinity=1,2,3,4,5,6,7,8,9,10,11,12,13,14,15,16,17,18,19,20,21,22,23,24,25,26,27,28,29,30,31,32
I wanna find out how exactly those "efficient cores" are connected.
But i just made one quick test.
I did tested 'disable efficiency cores' route in the past, and results were worse than with them. But forcing VaM to use only 'performance' ones for the physics was a good idea.
I'm pretty sure 'performance' cores are the 'very first' for intel. So it's 0-7 [or 1-8], no 1,3,5 etc. So with that in mind i changed config, and here are results:
Holy crap!!
nice, that is a the current record for baseline3 I think. What happens if you enable HT in bios and use 1,3,5,7,9,11,13,15 ? In theory they should be the same.Sorry, i won't be able to run these many tests at the moment, at least for the next 48 hours.
But i just made one quick test.
I did tested 'disable efficiency cores' route in the past, and results were worse than with them. But forcing VaM to use only 'performance' ones for the physics was a good idea.
I'm pretty sure 'performance' cores are the 'very first' for intel. So it's 0-7 [or 1-8], no 1,3,5 etc. So with that in mind i changed config, and here are results:
View attachment 332707
Holy crap!!
I made that one yesterday, 5th image in my previous post [1.56 physics time].nice, that is a the current record for baseline3 I think. What happens if you enable HT in bios and use 1,3,5,7,9,11,13,15 ? In theory they should be the same.
Ah, now I see. Very peculiar, my only explanation is that intel downclocks their cores if HT is enabled, which doesnt happen with AMD. Also 4th and 5th image are pretty much identical performance wise, the few fps in such a high FPS scenario dont matter. So my guess is that on Intel disabling HT for VaM doesnt matter, but disabling HT system-wide does. Maybe intel core schedueler is already smart enough to not scheduel vam on HT cores?I made that one yesterday, 5th image in my previous post [1.56 physics time].
Yeah, it seems so.So my guess is that on Intel disabling HT for VaM doesnt matter, but disabling HT system-wide does.
Since i'm still packing up, i just run one more quick test.
HT enabled, same config as before.
So, as for intel... it's still the best to have HT disabled in bios
Damn, the 9700k is faster than my 5950x in the baseline3 benchmark. But it makes sense since the 9700k has ~50ns memory latency, while 5950x has about 65ns. Mind sharing the whole .csv? I need the zoomed in view of only a few frames while the benchmark is running.Patch10 with the following settings (9700k has no hyperthreading)
[threads]
computeColliders=6
skinmeshPart=1
affinity=1,2,3,4,5,6,7,8
View attachment 332744
Here's the plot for that
View attachment 332746
just as I suspected, the unity engine itselfs runs better on your 9700k than on my 5950x and better times in CharacterRun might give you more average fps. Try skinmeshPart=2 or 3 in the thread settings.Rename the attached file as ThreadProfile.zip (vamhub hates zips)
I've overclocked my 9700k to 4.9GHz all cores with no AVX offset - which helps
Last edited:
Yeah I tried 2 and it improved things a little further -will try 3just as I suspected, the unity engine itselfs runs better on your 9700k than on my 5950x and better times in CharacterRun might give you more average fps. Try skinmeshPart=2 or 3 in the thread settings.
Results as follow
skinmeshPart=1 - 128fps
skinmeshPart=2 - 133fps - winner
skinmeshPart=3 - 130fps
Not much in - but when loading a single character in an empty scene with skinmeshPart=2 I was getting 350fps - with skinmeshPart=1 only 250fps - that's quite a difference.
One question, can these paremeters be changed on the fly? could they be hooked into via a plugin?
the difference between 250fps and 350fps is 1.14ms, multithreaded skinmeshPart barely makes a difference once you have a complex scene and even lowers performance on AMD. So in my experience it only benefitted on static scenes where just one character is shown without movement and there you get 250+ fps anyway, who needs 350fps? I will think about making it switch to multithreaded when only 1 character is registered in the scene.Results as follow
skinmeshPart=1 - 128fps
skinmeshPart=2 - 133fps - winner
skinmeshPart=3 - 130fps
Not much in - but when loading a single character in an empty scene with skinmeshPart=2 I was getting 350fps - with skinmeshPart=1 only 250fps - that's quite a difference.
One question, can these paremeters be changed on the fly? could they be hooked into via a plugin?
Amazing work @turtlebackgoofy . I have no idea what you are doing but keep doing it, please.
Didn't have enough time to run the full MacGruber Benchmark with small changes.
So tried with the Cyber Striptease CuddleMocap scene. I saw it was CPU limited with ~50-60% GPU usage at 1440p. Didn't see much FPS change with this CPU patch in scenes that were GPU limited >95% GPU usage.
Tested a couple of different ways to boost FPS for CPU limited scenes.
 Go from 90->177 FPS
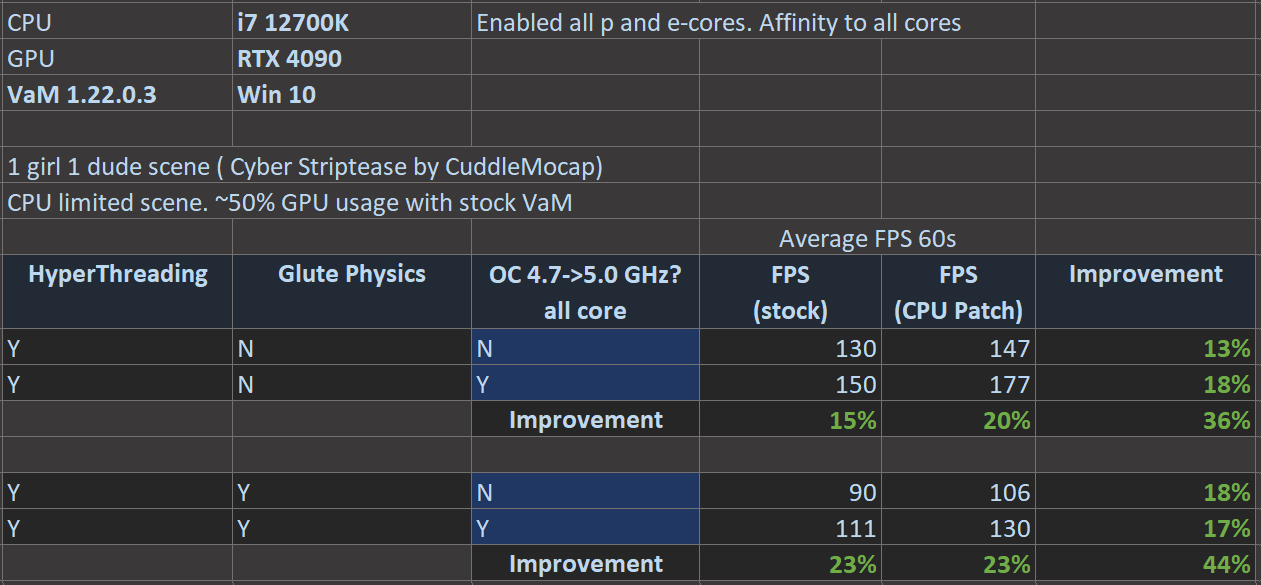
The hybrid Intel CPUs might have weird behavior in Win 10 on disabling e-cores or HyperThreading. I saw 5% less performance on HyperThreading disable.
And super-inconsistent frame rate on disabling e-cores althogether with CPU process affinity in the CPU patch. Sometime FPS was 50% lower, sometimes on par with all-core affinity.
Best Setting (at least for my CPU-GPU in Win 10):
So tried with the Cyber Striptease CuddleMocap scene. I saw it was CPU limited with ~50-60% GPU usage at 1440p. Didn't see much FPS change with this CPU patch in scenes that were GPU limited >95% GPU usage.
Tested a couple of different ways to boost FPS for CPU limited scenes.
- Apply turtlebackgoofy's CPU Patch
- Turn off Glute Physics
- CPU OC all-core by +0.3 Ghz
The hybrid Intel CPUs might have weird behavior in Win 10 on disabling e-cores or HyperThreading. I saw 5% less performance on HyperThreading disable.
And super-inconsistent frame rate on disabling e-cores althogether with CPU process affinity in the CPU patch. Sometime FPS was 50% lower, sometimes on par with all-core affinity.
Best Setting (at least for my CPU-GPU in Win 10):
- HyperThreading ON + All cores affinity for Intel Hybrid CPUs
- Use turtlebackgoofy's CPU patch
- Turn off glute physics if possible
- OC core clocks within safe temperatures
as expected my patch is just a flat increase on all all cases and the more FPS you have the less FPS difference it makes. However another user saw very slight gains on disabling e-cores and hyperthreading on his 13900k https://hub.virtamate.com/threads/performance-patch-up-to-30-more-physics-speed.49679/post-148760Didn't have enough time to run the full MacGruber Benchmark with small changes.
So tried with the Cyber Striptease CuddleMocap scene. I saw it was CPU limited with ~50-60% GPU usage at 1440p. Didn't see much FPS change with this CPU patch in scenes that were GPU limited >95% GPU usage.
Tested a couple of different ways to boost FPS for CPU limited scenes.
Seeing large gains (15-20%) from all three methods. Combine for maximum effect
- Apply turtlebackgoofy's CPU Patch
- Turn off Glute Physics
- CPU OC all-core by +0.3 Ghz
Go from 90->177 FPS
View attachment 333005
The hybrid Intel CPUs might have weird behavior in Win 10 on disabling e-cores or HyperThreading. I saw 5% less performance on HyperThreading disable.
And super-inconsistent frame rate on disabling e-cores althogether with CPU process affinity in the CPU patch. Sometime FPS was 50% lower, sometimes on par with all-core affinity.
Best Setting (at least for my CPU-GPU in Win 10):
- HyperThreading ON + All cores affinity for Intel Hybrid CPUs
- Use turtlebackgoofy's CPU patch
- Turn off glute physics if possible
- OC core clocks within safe temperatures
what were your physics rate and physics cap settings? What was the physics time?
There are two different types of frames that happen: one without a physics update and one with it.
When a physics update happens vam and unity go through a lot of CPU intensive work that do glute physics and collision calculations, this frame then gets recorded as a "min FPS" and the physicsTime > 0.
When no physics update happens just the frame itself gets rendered with all scripts, morphs and effects taken into account, the physicsTime is 0. Improving physics time when it does happen is the most beneficial imho, because it would allow higher physics rate for smoother movements. I think all optimizations should focus on this.
Improving the physics-free time on the other hand gives you more FPS exponentially since you
1) shorten the physics-free frame
2) get more of these physics-free frames in between physics frames
Improving only the physics-free frames widens the gap between min and max fps, which might feel as "stuttering". I think I will add an additional time in the Performance Monitor, the "physics time when it did happen" average, which is not dilluded by the "easy" frames.
Similar threads
- Replies
- 4
- Views
- 3K


