Performance Patch (up to 30% more physics speed)

turtlebackgoofy

Well-known member
Messages
222
Reactions
453
Points
63
Please continue discussion in https://hub.virtamate.com/threads/c...to-30-faster-physics-up-to-60-more-fps.49738/


Old message
As mentioned in the Benchmark Results thread, here is my performance patch.
Offloaded most CPU demanding functions to a native dll and did clang optimizations with profiling.
Mainly SkinMeshPart and ComputeColliders were sped up and turned into multithreaded.
Instructions in included Readme.

Resource pending approval:

VaM is unoptimized and does a lot of random memory access, which makes the skin meshing in scenes with multiple persons or many morphs very slow. By heavily multithreading it you can bruteforce the best RAM access order and sometimes you get crazy high frame times for a few frames. Overall you can expect about 15% better physics time. Please post your benchmarks from https://hub.virtamate.com/threads/benchmark-result-discussion.13131/ with and without the patch.

My tests with a clean install vam:

vanilla:
vanilla.png


vanilla with processaffinity to CCD1:
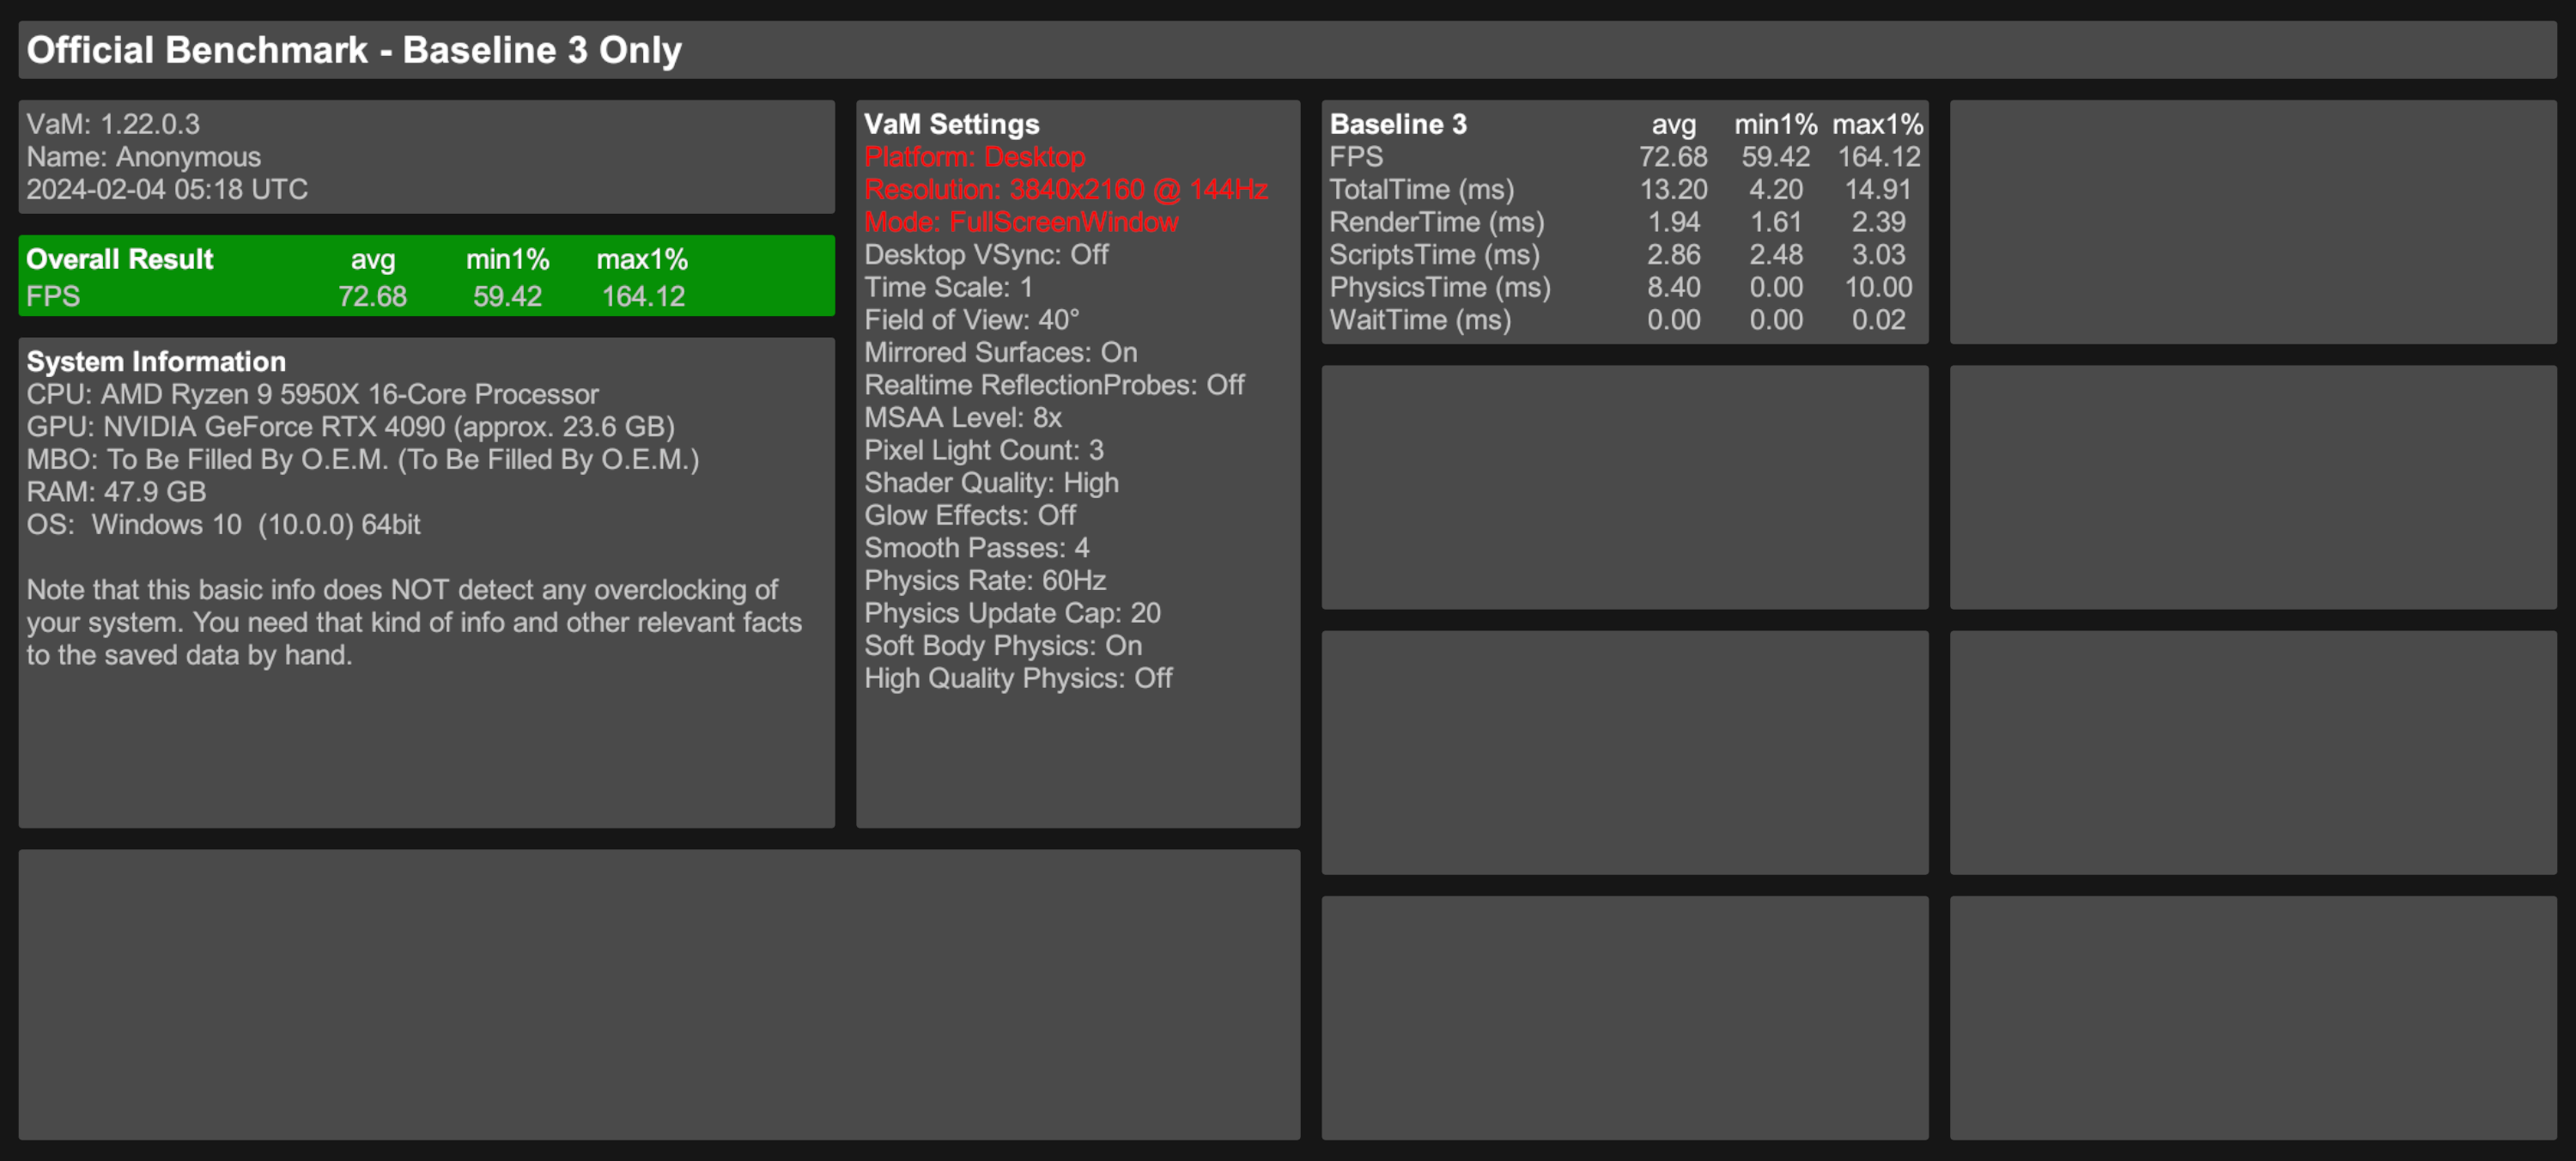
vanilla_procaffinity.png


with performance patch (automaticaly sets CCD at start)
patched9.png


So yeah, a crispy 60% FPS increase for me.

Also a version which removes performance hits from having a lot of vars installed. This was because morphs which were not used, but were installed still were checked every frame. Also loading cloths/hair from every var no longer loads cloths/hair from every var for each cloth/hair loaded, which speeds up scene loading when you have a lot of vars installed.

link removed, wait for official release in https://hub.virtamate.com/resources...to-30-faster-physics-up-to-60-more-fps.43427/

It even helps a little when you no vars are installed, since the unused 1000 builtin morphs already hinder FPS.

with performance patch and moprh clutter patch
varclutterfix.png
 
Last edited:
This is still in testing.
Please post your
- Physics Time gains (In the performance monitor)
- CPU (and if you use gaming mode or something)
- RAM speed and CAS
- Any visual or other bugs you experience

So I can find out why the newest generation of CPUs is 400% faster in VaM dispite beeing only 20% faster in other benchmarks lol
 
I wouldn't say it's 400% faster. It's not even x2 faster comaparing to like 4 years old 10th gen intel cpus.
The thing is, there is no way to exlude cpu performance alone in VAM, and even at 1080p 'cpu stress' baseline3\simpler physics, VaM is still highly demanding on GPU.
And now, with 40xx serie [and let's be honest, most people with top tier CPU does have 4080 \ 4090 gpus...] we are reaching much higher results, almost eliminating GPU bottleneck.
Example, same system, same cpu\ram, VaM install.
13900k + 3090 [1080p] :

Benchmark-20221119-200516.png
13900k + 4090 [at 1440 lol]:

Benchmark-20221210-174033.png
Out of curiousity, my very old 10th gen benchmark.

Benchmark-20220108-231056.png
 
I wouldn't say it's 400% faster. It's not even x2 faster comaparing to like 4 years old 10th gen intel cpus.
The thing is, there is no way to exlude cpu performance alone in VAM, and even at 1080p 'cpu stress' baseline3\simpler physics, VaM is still highly demanding on GPU.
And now, with 40xx serie [and let's be honest, most people with top tier CPU does have 4080 \ 4090 gpus...] we are reaching much higher results, almost eliminating GPU bottleneck.
Example, same system, same cpu\ram, VaM install.
13900k + 3090 [1080p] :

13900k + 4090 [at 1440 lol]:

Out of curiousity, my very old 10th gen benchmark.

your physics time is 1.86ms on 13900k, while my 5950x is about 9ms, so yeah its a 400% increase
 
GPU?
The difference between 13900k and 10900k [while both using 3090, and 10th gen using DDR4 3600, 13th gen DDR5 5600] is not even x2.
Also, yeah, seems like VaM doesn't like AMD at all if it's not x3d cache.
 
i
your physics time is 1.86ms on 13900k, while my 5950x is about 9ms, so yeah its a 400% increase
I looked back your result and I think your cpu underperformed heavily for some reason. I had a 6 core 5600x before and I know zen 3 cpus can give around 5ms average and 8ms low for baseline 3 physicstime (that is like 80-90 fps for low with a 6800xt) in 1080p.. You need to check it with the usual stuff (fresh vam, no apps hogging in win background etc). If it still bad, then test outside with something, like cinebench if you get what you should with your cpu. If there is a problem check your bios settings aswell, may be you did not set xmp or something.. Also cpu and ram tweaks are rewarded by vam. Use some curve optimization, set power limits well and a good kit of ddr4 ram can work with 3800-3900 mhz with nice timings, use process lasso to tie vam for a specific ccx, turn on smt (amd HT) if it was disabled for some reason - amd performs better with that. A 4090 that you got should have made to work that cpu waaay better.
On the other hand I am also glad that it made you take the work with this patch. :)
 
Last edited:
i

I looked back your result and I think your cpu underperformed heavily for some reason. I had a 6 core 5600x before and I know zen 3 cpus can give around 5ms average and 8ms low for baseline 3 physicstime (that is like 80-90 fps for low with a 6800xt) in 1080p.. You need to check it with the usual stuff (fresh vam, no apps hogging in win background etc). If it still bad, then test outside with something, like cinebench if you get what you should with your cpu. If there is a problem check your bios settings aswell, may be you did not set xmp or something.. Also cpu and ram tweaks are rewarded by vam. Use some curve optimization, set power limits well and a good kit of ddr4 ram can work with 3800-3900 mhz with nice timings, use process lasso to tie vam for a specific ccx, turn on smt (amd HT) if it was disabled for some reason - amd performs better with that. A 4090 that you got should have made to work that cpu waaay better.
On the other hand I am also glad that it made you take the work with this patch. :)
slowest possible ram, my benchmark matches other 5950x systems
 
slowest possible ram, my benchmark matches other 5950x systems
Cmon then, you are starving out that zen then! :D
On AM4 ddr4 overclock is a breeze, almost any 3200CL16 can be tweaked optimally for zen3 and if you check the bench results here they are not much behind in lows compred to current gens. I admit latest I9 and zen4x3d are brutal, but vam is not an esport title needing insanely high fps. Just dial in you setup for pushing the screen refresh rate with the lows and you are golden. I doubt you need anything above stable 90 fps which is possible with zen3s already. Of course resulotion matters, but that depends on gpu.
 
Thank you very much for this patch. This is a game changer!

Question: Do you know if for an i9-14900KF with P&E&HT Cores the same numbers are to be applied?
  • P: 8/16 (8 HT)
  • E: 16/16 (0 HT)
Gives 24 physical and 8 HT cores; or 32 cores alltogether. 75% of 32 Cores equals 24 cores to be entered in your ini config file.
Not sure if the power and efficiency cores are handled equals / same as physical count.
the 14900kf seems to have "smart cache". No idea how it is wired to the cores. I guess you need vam to run on only the performance cores which are directly connected to the L3 cache and leave 25% for other unity work for the best performance.
Either way you could just put it at

[threads]
computeColliders=6
skinmeshPart=1
CCD=0
IterateCCD=0

And afterwards try to set process affinity in taskmanager to Core 0-7.
 
I was getting slightly more FPS when forcing VAM to use only 8P cores (non HT ones) and switching all background processes to E cores with Process Lasso.
This patch also helps, not sure if it's 15% but definitely noticeable difference.

//edit
@turtlebackgoofy I think he needs to set affinity to cores 0, 2, 4, 6, 8, 10, 12, 14 (non HT Perf cores).
0-7 means 4 P cores + 4 P HT cores.

What does the CCD does?
 
Last edited:
One part that I can't understand: Why VaM with ~5k vars makes my scenes to have like 20-30 fps less than clean vam instance.
I understand that a lot of vars can slow down startup and loading times but why does it affects fps when everything is loaded?
 
I was getting slightly more FPS when forcing VAM to use only 8P cores (non HT ones) and switching all background processes to E cores with Process Lasso.
This patch also helps, not sure if it's 15% but definitely noticeable difference.

//edit
@turtlebackgoofy I think he needs to set affinity to cores 0, 2, 4, 6, 8, 10, 12, 14 (non HT Perf cores).
0-7 means 4 P cores + 4 P HT cores.

What does the CCD does?
the 14900kf doesnt have HT. CCD is just to limit VAM to first half of cores or second half of cores, so the same as process lasso.
One part that I can't understand: Why VaM with ~5k vars makes my scenes to have like 20-30 fps less than clean vam instance.
I understand that a lot of vars can slow down startup and loading times but why does it affects fps when everything is loaded?
Its because when a var is installed, it's morphs are loaded into the morphbank, even if they arent used in the current scene. On every frame, the morphbank gets searched in the method ApplyMorphsThreadedFast, which in turn calls GetMorph and that one's execution time grows the more morph vars you have installed. But I will recheck it.
 
Didn't know that 14900 doesn't have HT. I'm on 13900k
Ohh, thanks, so lowering number of vars with morphs could help. Or making GetMorph faster, can't imagine why this method would have different complexity than O(1).
 
Didn't know that 14900 doesn't have HT. I'm on 13900k
Ohh, thanks, so lowering number of vars with morphs could help. Or making GetMorph faster, can't imagine why this method would have different complexity than O(1).
doing a profile without vars and with a lot of vars right now, its already taking 1000 as long lol
 
Code:
public bool ApplyMorphsThreadedFast(
    Vector3[] verts,
    Vector3[] visibleNonPoseVerts,
    DAZBones bones)
  {
    bool flag1 = true;
    int num1 = 5;
    bool flag2 = false;
    int length = verts.Length;
    while (flag1)
    {
      --num1;
      if (num1 != 0)
      {
        flag1 = false;
        for (int index = 0; index < this._morphs.Count; ++index)
        {
          DAZMorph morph1 = this._morphs[index];
          if (!morph1.disable)
)

does it iterate over ALL morphs I have in VaM on every frame?? Or rather all morphs that are used in current scene?
Why num1=5?

//edit
ohh ok, so it goes over this._morphs up to 5 times or unless no morphs are changed in given iteration
 
Last edited:
Code:
public bool ApplyMorphsThreadedFast(
    Vector3[] verts,
    Vector3[] visibleNonPoseVerts,
    DAZBones bones)
  {
    bool flag1 = true;
    int num1 = 5;
    bool flag2 = false;
    int length = verts.Length;
    while (flag1)
    {
      --num1;
      if (num1 != 0)
      {
        flag1 = false;
        for (int index = 0; index < this._morphs.Count; ++index)
        {
          DAZMorph morph1 = this._morphs[index];
          if (!morph1.disable)
)

does it iterate over ALL morphs I have in VaM on every frame?? Or rather all morphs that are used in current scene?
Why num1=5?

//edit
ohh ok, so it goes over this._morphs up to 5 times or unless no morphs are changed in given iteration
this._morphs contains all morphs from all vars that fit in the morphbank specifications (male, female, etc) and MIGHT be enabled in the scene later. Even though it iterates up to 5 times, it still iterates over ALL morphs in this._morphs and skips most, since they are disabled. So the "if (!morph1.disable)" check is what eats up performance. It's mainly because it evicts the CPU cache when iterating over not-needed morphs.

Comparing the profiler timings for the same scene per render frame (the ms difference in a non-profiled run will be smaller, but it's still wasted CPU time):
no vars
ThreadCall countMethod nameMethod name2Method name3Total runtime (ms)Total runtime no waste(ms)Total allocation (bytes)per frame
56​
258​
DAZMorphBank:ApplyMorphsThreadedFast (UnityEngine.Vector3[],UnityEngine.Vector3[],DAZBones)DAZCharacterRun:RunThreaded (bool)unknown
155.23​
155.172​
0​
1.20333333​
90​
258​
DAZMorphBank:ApplyMorphsThreadedFast (UnityEngine.Vector3[],UnityEngine.Vector3[],DAZBones)DAZCharacterRun:RunThreaded (bool)unknown
151.443​
151.394​
4096​
1.17397674​
64​
258​
DAZMorphBank:ApplyMorphsThreadedFast (UnityEngine.Vector3[],UnityEngine.Vector3[],DAZBones)DAZCharacterRun:RunThreaded (bool)unknown
149.812​
149.763​
0​
1.16133333​
77​
258​
DAZMorphBank:ApplyMorphsThreadedFast (UnityEngine.Vector3[],UnityEngine.Vector3[],DAZBones)DAZCharacterRun:RunThreaded (bool)unknown
148.149​
148.091​
4096​
1.14844186​
43​
258​
DAZMorphBank:ApplyMorphsThreadedFast (UnityEngine.Vector3[],UnityEngine.Vector3[],DAZBones)DAZCharacterRun:RunThreaded (bool)unknown
118.103​
118.062​
0​
0.91552713​
5.6026124​
lots vars
ThreadCall countMethod nameMethod name2Method name3Total runtime (ms)Total runtime no waste(ms)Total allocation (bytes)per frame
77​
322​
DAZMorphBank:ApplyMorphsThreadedFast (UnityEngine.Vector3[],UnityEngine.Vector3[],DAZBones)DAZCharacterRun:RunThreaded (bool)unknown
306.531​
306.448​
8192​
1.90391925​
90​
322​
DAZMorphBank:ApplyMorphsThreadedFast (UnityEngine.Vector3[],UnityEngine.Vector3[],DAZBones)DAZCharacterRun:RunThreaded (bool)unknown
287.761​
287.677​
8192​
1.7873354​
64​
322​
DAZMorphBank:ApplyMorphsThreadedFast (UnityEngine.Vector3[],UnityEngine.Vector3[],DAZBones)DAZCharacterRun:RunThreaded (bool)unknown
281.346​
281.281​
0​
1.74749068​
56​
322​
DAZMorphBank:ApplyMorphsThreadedFast (UnityEngine.Vector3[],UnityEngine.Vector3[],DAZBones)DAZCharacterRun:RunThreaded (bool)unknown
272.618​
272.554​
0​
1.6932795​
43​
322​
DAZMorphBank:ApplyMorphsThreadedFast (UnityEngine.Vector3[],UnityEngine.Vector3[],DAZBones)DAZCharacterRun:RunThreaded (bool)unknown
205.434​
205.376​
0​
1.27598758​
8.40801242​
 
So something as simple as making that method using new list: this._enabledMorphs so we don't iterate over everything could help a lot for most of the people (most of us has more than few hundreds vars I assume).
The question is how to make _enabledMorphs up-to-date when morphs are enabled/disabled.
 
this._morphs contains all morphs from all vars that fit in the morphbank specifications (male, female, etc) and MIGHT be enabled in the scene later. Even though it iterates up to 5 times, it still iterates over ALL morphs in this._morphs and skips most, since they are disabled. So the "if (!morph1.disable)" check is what eats up performance. It's mainly because it evicts the CPU cache when iterating over not-needed morphs.

Comparing the profiler timings for the same scene per render frame (the ms difference in a non-profiled run will be smaller, but it's still wasted CPU time):
no vars
ThreadCall countMethod nameMethod name2Method name3Total runtime (ms)Total runtime no waste(ms)Total allocation (bytes)per frame
56​
258​
DAZMorphBank:ApplyMorphsThreadedFast (UnityEngine.Vector3[],UnityEngine.Vector3[],DAZBones)DAZCharacterRun:RunThreaded (bool)unknown
155.23​
155.172​
0​
1.20333333​
90​
258​
DAZMorphBank:ApplyMorphsThreadedFast (UnityEngine.Vector3[],UnityEngine.Vector3[],DAZBones)DAZCharacterRun:RunThreaded (bool)unknown
151.443​
151.394​
4096​
1.17397674​
64​
258​
DAZMorphBank:ApplyMorphsThreadedFast (UnityEngine.Vector3[],UnityEngine.Vector3[],DAZBones)DAZCharacterRun:RunThreaded (bool)unknown
149.812​
149.763​
0​
1.16133333​
77​
258​
DAZMorphBank:ApplyMorphsThreadedFast (UnityEngine.Vector3[],UnityEngine.Vector3[],DAZBones)DAZCharacterRun:RunThreaded (bool)unknown
148.149​
148.091​
4096​
1.14844186​
43​
258​
DAZMorphBank:ApplyMorphsThreadedFast (UnityEngine.Vector3[],UnityEngine.Vector3[],DAZBones)DAZCharacterRun:RunThreaded (bool)unknown
118.103​
118.062​
0​
0.91552713​
5.6026124​
lots vars
ThreadCall countMethod nameMethod name2Method name3Total runtime (ms)Total runtime no waste(ms)Total allocation (bytes)per frame
77​
322​
DAZMorphBank:ApplyMorphsThreadedFast (UnityEngine.Vector3[],UnityEngine.Vector3[],DAZBones)DAZCharacterRun:RunThreaded (bool)unknown
306.531​
306.448​
8192​
1.90391925​
90​
322​
DAZMorphBank:ApplyMorphsThreadedFast (UnityEngine.Vector3[],UnityEngine.Vector3[],DAZBones)DAZCharacterRun:RunThreaded (bool)unknown
287.761​
287.677​
8192​
1.7873354​
64​
322​
DAZMorphBank:ApplyMorphsThreadedFast (UnityEngine.Vector3[],UnityEngine.Vector3[],DAZBones)DAZCharacterRun:RunThreaded (bool)unknown
281.346​
281.281​
0​
1.74749068​
56​
322​
DAZMorphBank:ApplyMorphsThreadedFast (UnityEngine.Vector3[],UnityEngine.Vector3[],DAZBones)DAZCharacterRun:RunThreaded (bool)unknown
272.618​
272.554​
0​
1.6932795​
43​
322​
DAZMorphBank:ApplyMorphsThreadedFast (UnityEngine.Vector3[],UnityEngine.Vector3[],DAZBones)DAZCharacterRun:RunThreaded (bool)unknown
205.434​
205.376​
0​
1.27598758​
8.40801242​

A solution would be to somehow make all morphs not load into this._morphs but into this._unactivatedMorphs inside the function BuildMorphsList()
 
True, but this still requires updating all places that can flip morph.disable so we remove it from one list and add to other. And it can make enabling morph slower since the update would run in O( n ) but maybe it wouldn't be noticable.
 
[Error :VAMPatches] Morph count: 13602
[Error :VAMPatches] Inactive count: 103630
[Error :VAMPatches] Disabled morphs count: 0
Very interesting, The disabled morphs count is always 0 but I don't think Benchmark scene is using 13.6k morphs.

Clean vam for comparison:
[Error :VAMPatches] Morph count: 1361
[Error :VAMPatches] Inactive count: 0
[Error :VAMPatches] Disabled morphs count: 0
 
Very interesting, The disabled morphs count is always 0 but I don't think Benchmark scene is using 13.6k morphs.

Clean vam for comparison:
true, it appears "enabled" means the morph is visible in the morphs UI. The important part is if this._morphs.morphValue != 0.0f, which is the slider position if you dont want to use a morph in a scene.
So a solution would be to have 2 seperate lists, one for all possible morphs and one for all morphs whose morphvalue is != 0.0f. When setting a morph != 0.0f it should then be moved to the active morph list which gets used in ApplyMorphsThreadedFast and when setting it to 0.0f it should be removed from it. Working on it right now. Might even improve performance on a clean vam, since it still has 1300 unused morphs.
 
Maybe even simply changing the condition could help a lot (without going into two lists straight away)?
from
if(!morph.disable)
to
if(morph.active)
 
Maybe even simply changing the condition could help a lot (without going into two lists straight away)?
from
if(!morph.disable)
to
if(morph.active)
no, it has to be two separate lists, because DAZMorph is an object and has about 80 fields, which is about 640bytes per DAZMorph. When the list is 13602 long, thats 8.3MBytes of memory all over the RAM that gets iterated through, which will evict the entirety of CPU L3 cache. This will itself take a long time and make everything afterwards slower.

_morphs[13602] is a chunk of 13602*8b memory with pointers to DAZMorphs all over the heap
DAZMorph itself is a 640b chunk of memory, whose fields get read in the beginning and the end.

Since we are talking about saving 100uS each frame, even such small reads tank performance.
 
Back
Top Bottom