Benchmark - clear install vs many vars

rabbit1qaz

Active member
Messages
363
Reactions
45
Points
28
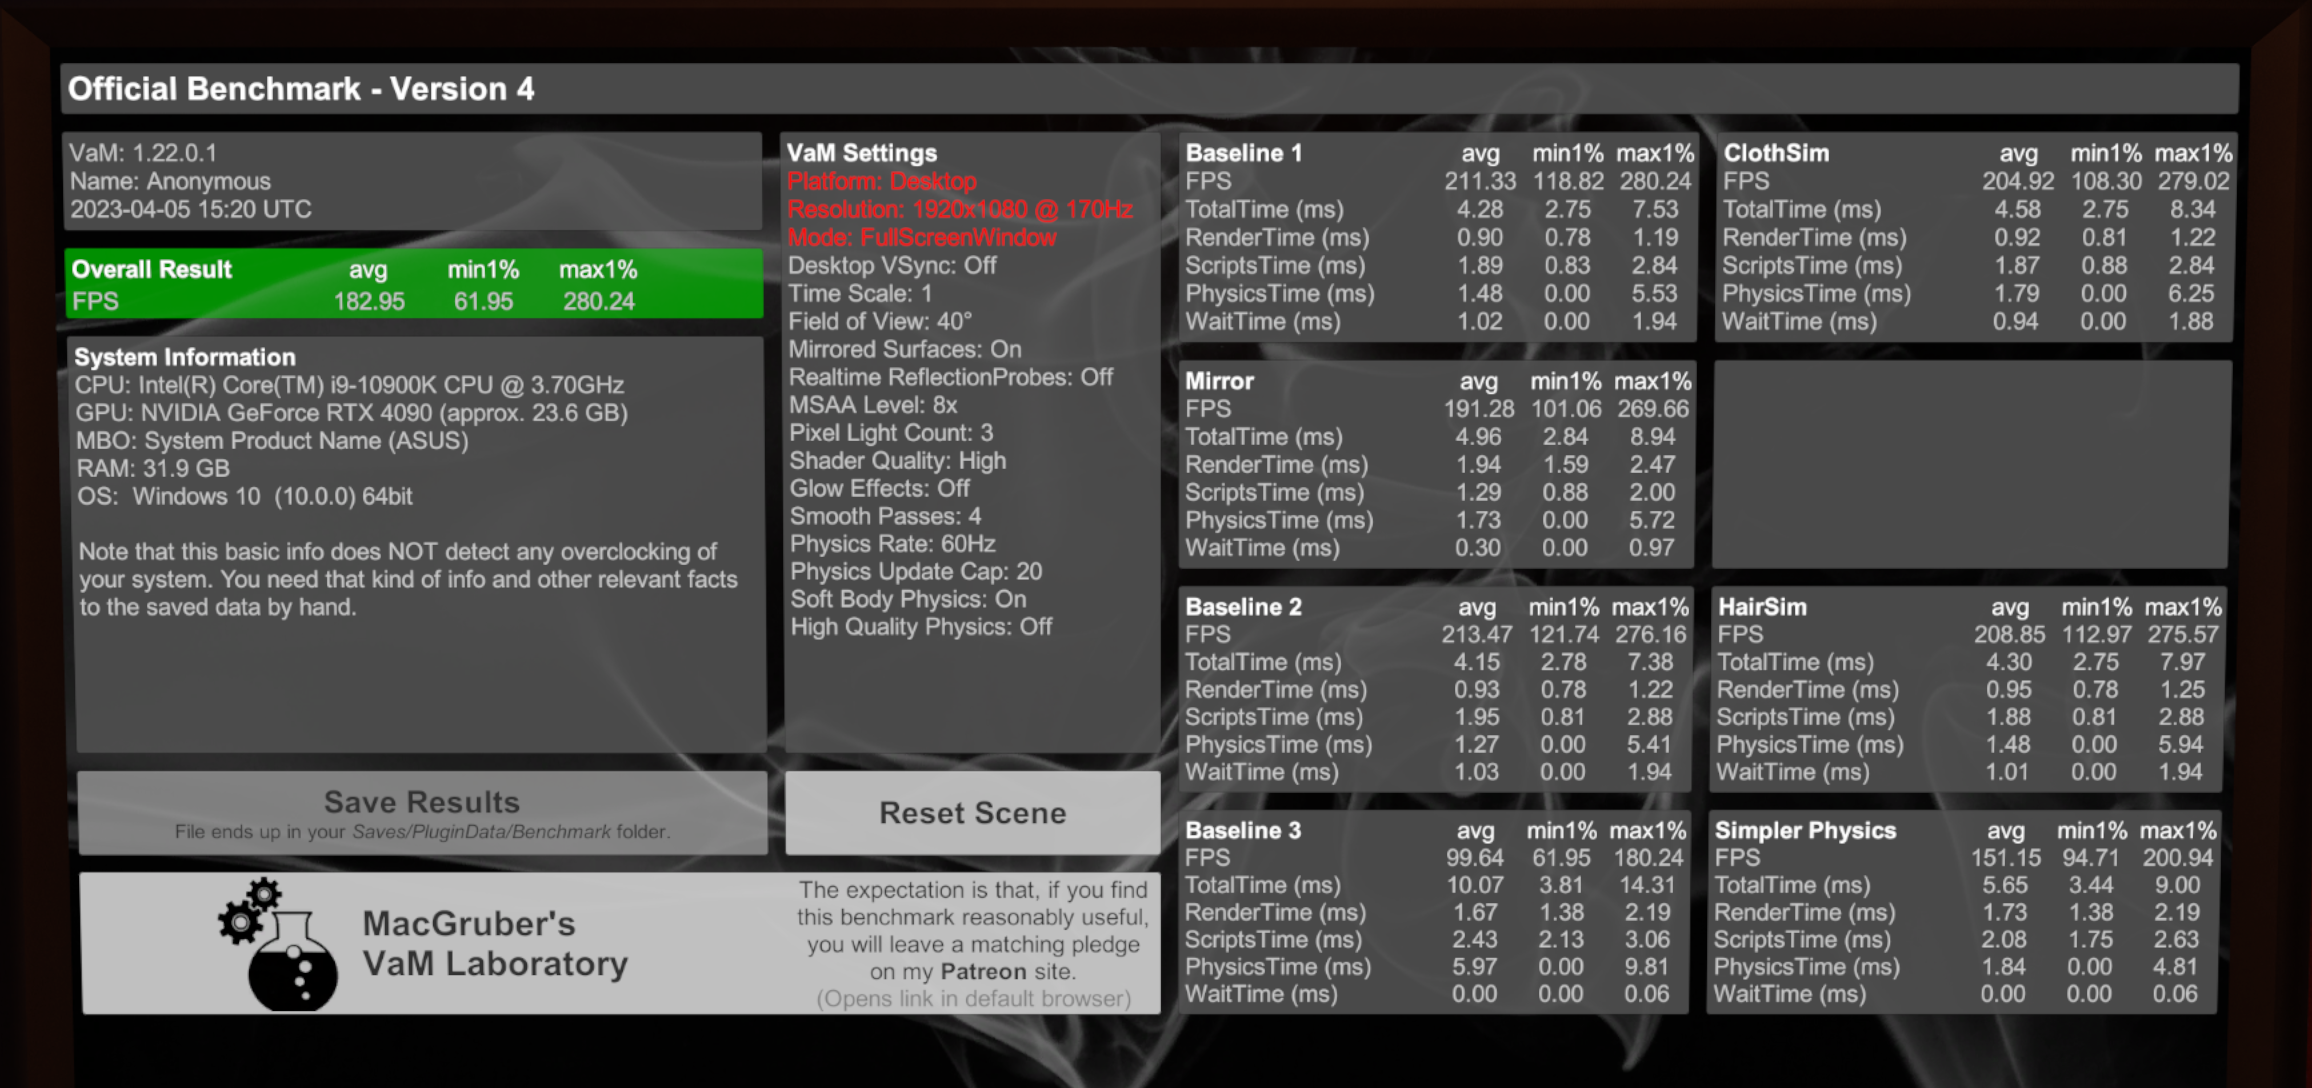
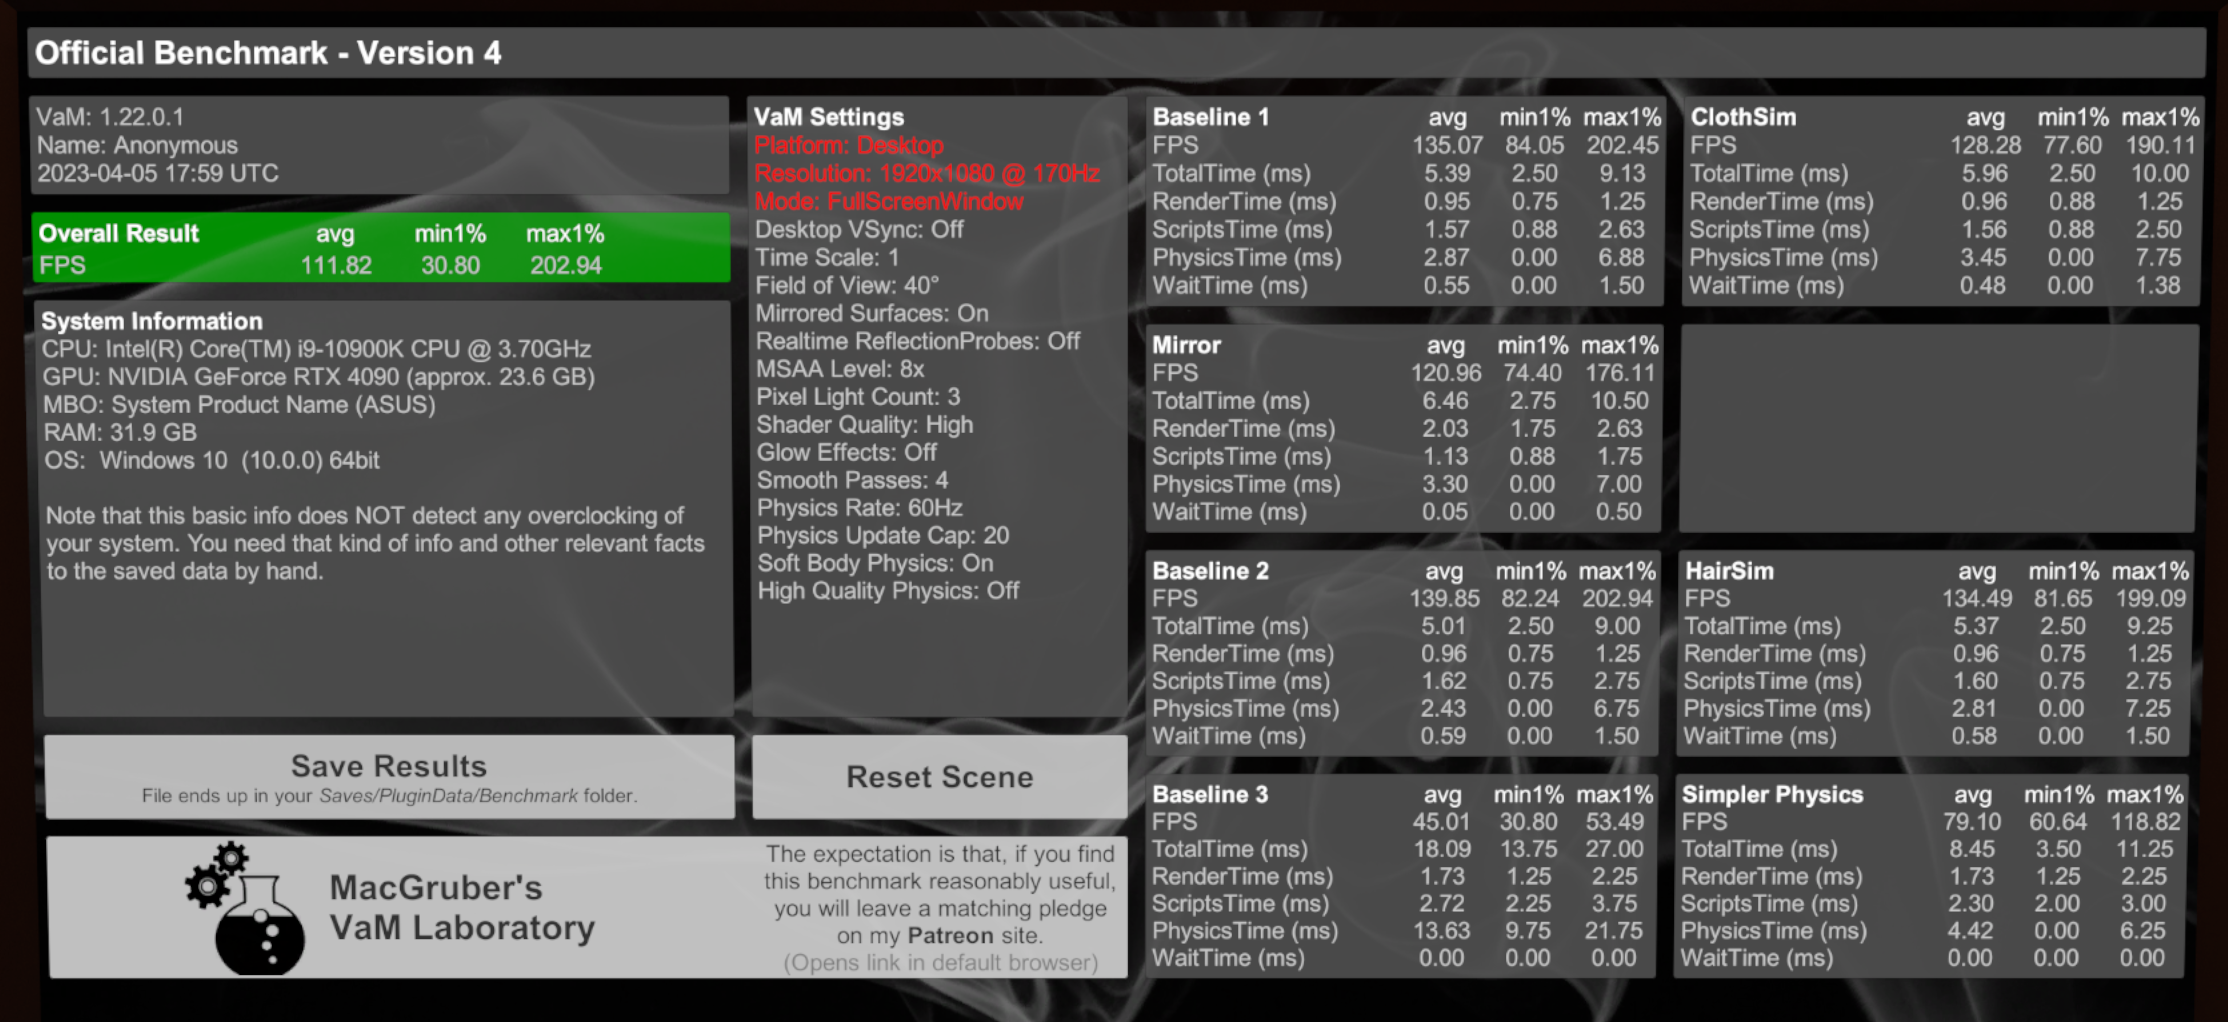
Hi ive just tested clean install of newest VAM with just MCGruber benchmark and its dependency with my 2year var gatherer. And the difference was huge.

New install: overall avg 178, old intstal 101 thats f..king 80%. All was ttested on same settings with no session plugins. Why the hell is that difference? i know there is thousends of vars in there, but it shouldnt affect performance but loading times or showing menus only.

in details there is very little diffrence in RenderTime(almost no diff) and ScriptsTime(about 15%) , but more than 200% diffrence in PhysicsTime and in WaitTime in all tests.

benchmark clean with addon copy.png

benchmark new uncompres2.png
 
Last edited:
Why the hell is that difference? i know there is thousends of vars in there, but it shouldnt affect performance but loading times or showing menus only.
This phenomenon has been observered pretty much since the Benchmark existed. We have never found out why. Theoretically it could be that some parts of the scene are still loading, but VaM already signaled that loading "finished". It could theoretically be that a few very slow frames at the beginning drag down the average. However, the Benchmark waits 0.6 seconds after loading finished, checking whether something else might start loading, which would reset that 0.6 sec clock. Then waits another second for fade from black and only then starts recording timings. So, that should be the correct way to ignore loading performance.

Another explaination could simply be heat. During loading your CPU has to crawl all those VARs, causing it to heat up. During the benchmark it would reach it's heat limit sooner, causing it to throttle down a bit, making it slower. However, if that were the case, people with good cooling wouldn't notice the issue.

Since I can't repro the problem myself, my VaM folders are simply not that spammed with stuff, not to mention lack of time.....what you could do is pick a few particular points late in the scenes and take manually note of the FPS there. Repeat a few times to make sure your data is consistent and not just noise. If you notice these obvious differences that way as well, then it's not loading, but some weird thing VaM does in the background.


Edit: By the way, you can use the "Save Results" button which has the plugin make the screenshot for you...no need to manually make screenshots ;)
 
No. Its not problem of benchmark. Same situation is simply for Default scene in VAM. in "clear" version i have about 215FPS (check after 30sek after load reset) and in Old one i get 115. So there is huge impact on performance with many vars. ( i do clean instal and just copy all vars and its the same so its not problem of updating old instalation).

" It could theoretically be that a few very slow frames at the beginning drag down the average. " - no its almost constant FPS during whole test for each test from begining to end of test.

" causing it to heat up. During the benchmark it would reach it's heat limit sooner, causing it to throttle down a bit, making it slower " - no. i have very good cooling both with gpu and cpu (and psu ;) ).

Seem that physisc is fu...cked up ive asked meshed directly if they observe such behaviour . Also i talk with some other user who also have old instalation but he extract every var so his loading times are beter but he has same situation with FPS, so it seem the problem isalso not with crawling to vars, but still it may load every extracted data and made some list with it, but as in that case doing benchmark second time without closing should get normal FPS but it isnt. same low fps after 2 times(i will try 3 and 4 time today to be sure).
 
Last edited:
Like MacGruber said: well known problem. I would be interested in what MeshedVR says about it and if there's a fix to it. But I could imagine it's made by design (without knowing). The more files in your addonpackage folder, the slower VaM will run finally. Slowly but surely.
One user found out (if I remember correctly) it was all about the morphs. So integrate all stuff without the morphs should get you better results, if I remember correctly.
seem that i should get one installation with all gathered in which to create sth , and then export it to another just with that look :)
 
In general, VaM performance is not dependent on the number of vars. VaM performance is, however, dependent on the number of morphs if you get over a certain threshold. Why?

VaM runs a separate thread for each Person atom that does the following:
  • calculates bone changes
  • applies morphs
  • merges mesh (base + grafts)
  • recalcs skin collider sizes as needed due to morphs
  • soft-body calcs
  • skins mesh
  • more skin collider calcs
  • applies soft-body mesh changes
All of that generally runs while the main Unity thread is off doing other things, and completes before the main thread needs the output data. This is measured in 2 places. The FIXED Thread Wait, and the UPDATE Thread Wait. Now if you have a really good processor and GPU and are running in the hundreds of FPS range, you could find these Wait times to be non-zero. The entire thread time is measured by THREAD. Ultimately your FPS could be limited by the main thread or one of these side threads.

Everything on the side thread is not dependent on the number of vars, except for "applies morphs". That is dependent on the number of morphs. Due to complexities with formula morphs (morph controlled morphs - MCMs) and other factors, the "applies morphs" system in 1.X iterates over every possible morph to see if it is has changed compared to the last frame. This is normally fine with a reasonable number of morphs, but for those with 10000s of morphs this can become the critical factor and results in this side thread taking more time than the main thread and ultimately limiting your FPS. If I could easily fix it to a demand or event driven morph change system, I would, but as mentioned it is a bit more complex under the hood so this is not an easy change. Please note that even if you have the morphs set to not preload for a specific var file, they are still scanned and considered because a scene or trigger could activate them. So they are still part of the list of morphs that is iterated on. The preload off just prevents them from appearing in the UI.

My only suggestion at this time is to cull the number of morphs you have in your system by disabling or removing VAR files that have a lot of morphs and you are not regularly using.
 
I have MANY duplicated morphs where people include them in var files rather than reference a source creators var.
The solution I guess is to find every unique morph that is used and create one var called "morphs" and put all the unique ones in that, then strip every duplicate from every single var file and update the scene references.
I know there were plugins made for managing large var collections, does anybody know if there is one that does as above or a variation of it?
or not use vars, just extract them and use only extracted sorted data :)

PS: thanks Meshed for detailed info and hope that 2.x will do i better way and is going beta soon :)
 
Can anyone confirm if duplicated morphs are processed more than once?
 
Last edited:
So the user has to be wary of how many morphs there are? Okay, how do I determine the number of morphs? Or should I just keep an eye on a particular performance metric?
Besides running a clean install or extracting, is there another counter-measure, like turn off "preload morphs" or disabling MCMs?
 
best solution ive been using for long time, is to just unpack all vars and use what i need. Most vars have way to much uneeded stuff in them anyway.
 
it frustrates me when vars include files from other creators that are free on the hub.
Just reference their work and have it as a dependency. That's how it is supposed to work!
I really don't want to go through all my vars (I have basically every free hub download) and manually edit out duplicate morphs to point them to the original source. It's a total waste of time and a pain.
If there was a script that found all duplicate morphs, removed them from the var and pointed the scenes to the correct original location that would dramatically reduce the issue. But it has to be automated, unpacking and manually editing takes ages and if you have more than a couple dozen var files nobody has time for that.
I fully agree with this statement, Maybe someone could develop a program to take care of this? hell I would even donate to someone if a release was made.
Although I hope i have better luck with it than any of the var managers. Everytime I've tried to use one of them I just end up nuking the vars and fucking dependancies up... I've never seen an error log with more so and so expected X004349328 and was X0000000001 messages in my life. lol
 
Everything on the side thread is not dependent on the number of vars, except for "applies morphs". That is dependent on the number of morphs. Due to complexities with formula morphs (morph controlled morphs - MCMs) and other factors, the "applies morphs" system in 1.X iterates over every possible morph to see if it is has changed compared to the last frame.

This is very helpful, thank you!
May I ask if this is also true if I have several versions of the same var? Will the morphs be "applied" once for every version?
To illustrate with an example, if my AddonPackages contain "cotyounoyume.ExpressionBlushingAndTears.37.var" and "cotyounoyume.ExpressionBlushingAndTears.36.var", will all the morphs inside be applied twice (i.e. should I get rid of the older version)?


Hello le_hibou, your Python script has given me some insights. I've been analyzing the impact of the number of .var files in the addonpackages folder on load time and CPU usage efficiency. Your script gave me the idea to count the total number of morphs in all .var files in the entire addonpackages, which is very helpful for my analysis. Perhaps there will be some methods to handle this situation in the future.
Returning to your question, are the morphs in the old .var files in the addonpackages folder monitored or pre-loaded when VAM is running? From my personal tests, I believe the answer is yes.

I've tried to directly unzip over 20,000 .var files with 7-zip and throw them directly into the VAM directory to run. In the addonpackages folder, only the .var files that included VAMX and those that existed at the time of installation were retained. Then, I conducted "timing + recording" tests multiple times under the same scene in these two environments. As my background is in statistics, I needed to conduct more than 30 tests for the results to be reliable. With nearly 20,000 scenes existing in the scene browser, the difference in loading time for the same content was about 16 minutes versus 1 minute 30 seconds.:eek:?

The time it took for VAM itself to start and launch the scene browser was about 3 minutes versus 40 seconds.:) I work in data analysis and statistics, so I only trust the results of actual tests. You can refer to the EXTRACTOR script I wrote before and the .var file check script I just uploaded. I need some time to think about how to improve the path structure, so I haven't uploaded these recording results yet. But I'm confident that any user can reproduce this difference in operation.

Loading time and memory usage are of course very obvious experiences. However, about 24 hours ago, I tried to load the ALIVE plugin (without UI, only ALIVE) of SPAQ into two people in a scene. ALIVE, in my judgement, is a very complex PLUGIN that operates based on .NET FRAME. When I loaded ALIVE for the second person, the .NET heap sections limit was triggered, and VAM ended. My system memory is 196GB, and the RAM usage at the time was "only 45GB" ? , far from my system memory limit.

From my past experience, this is because .NET Frame has a limit of 1024 heap sections, each heap can store 65,536 objects/morphs. In other words, the upper limit of objects and morphs that the entire VAM software can load is about 67 million. Exceeding this will trigger a Fatal error. I've had similar situations when playing old games from Illusion Co., JP. This is common in the UNITY game development forum. The correct term is "Garbage Collector Unloading Problem", also known as "Data Fragmentation = Optimization Problem".

What I want to emphasize is: I probably know what happened, and maybe I know some small tricks that might improve the situation, but that doesn't mean this situation is easy to handle. Especially "the pre-fetching of files in memory, the usage rate of CPU in managing these data involves statistical "guessing skills"", this skill is very difficult and requires time, manpower and knowledge to carry out smoothly. Therefore, many large-scale production companies are extremely poor in optimization at the time of game release.

In the past, when INTEL was developing CPUs, they directly increased the cache capacity and pipeline length, ignoring the "data pre-read must perform statistical guess accuracy operation". The result was that the CPU of that era was slow, hot and power-consuming due to the negative impact of repeated
calculation and data fetching. The problems that INTEL and current large-scale game development companies cannot avoid, cannot be demanded that VAM will not encounter or can easily handle outside the ROAD MAP, this is really difficult.
 
Back
Top Bottom