• Hi Guest!

    We are extremely excited to announce the release of our first Beta1.1 and the first release of our Public AddonKit!
    To participate in the Beta, a subscription to the Entertainer or Creator Tier is required. For access to the Public AddonKit you must be a Creator tier member. Once subscribed, download instructions can be found here.

    Click here for information and guides regarding the VaM2 beta. Join our Discord server for more announcements and community discussion about VaM2.
  • Hi Guest!

    VaM2 Resource Categories have now been added to the Hub! For information on posting VaM2 resources and details about VaM2 related changes to our Community Forums, please see our official announcement here.

VaM 1.x GPU lag occurs randomly for a few seconds in complex scenes

Threads regarding the original VaM 1.x

supperGR

Well-known member
Featured Contributor
Joined
Oct 24, 2022
Messages
150
Solutions
1
Reactions
485
Hi there!

So, I’ve noticed that the GPU sometimes stutters for a couple of seconds when working on complicated scenes. o_O

Basically, when I’m editing heavy scenes—like ones with 380 atoms and a bunch of complex logic plugins—the GPU will lag here and there for a short moment. It doesn’t happen on a schedule or anything; sometimes it’s more often, sometimes not so much.

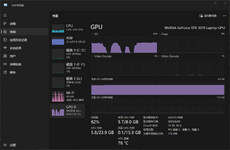
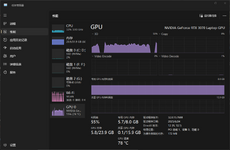
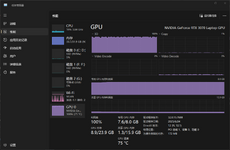
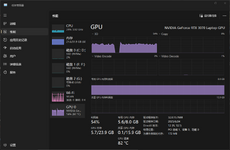
Here’s a screenshot from Task Manager taken when I was tweaking a character’s pose and ran into one of those lags.
⬇You can see how the GPU usage drops suddenly⬇
112.png111.png113.png
The cpu usage rate is also not high


But here’s the thing—even in other scenes that use more GPU power (like 337 atoms), I don’t see the any of the same kind of lago_O
114.png


Perhaps it's because there are a lot of logic plugins for the scene?? (It took 7 minutes to load my scene)
This situation does not occur in the (normal) scene created by others, even though also used over 300 atoms


CPU: AMD Ryzen 7 5800H with Radeon Graphics 3.20 GHz
GPU: NVIDIA GeForce RTX 3070 Laptop GPU
RAM: 32.0 GB
AddonPackages: 1840 vars
 
Last edited:
There's a plugin from ShadowVenom that times stuff when loading a scene. This may help you find clues on what may be hurting your scene to load and work on.

A somewhat random suggestion: try removing the clothes and hair on the persons and see if the lags continue. Then try with a different hair/clothes and compare.
 
Depending on the scene, i randomly get short freezes every now and then as well.

It didn't bother me enough to investigate in depth but a few years back i believe i read something along the lines of memory leaks in plugins. Maybe that triggers some internal garbage collection or VAMs memory optimization? You could observe the Heap Size in the Performance 2 tab for a while. It shouldn't increase dramatically over time.

I'm not an expert, and my memories are vague, so it's more or less guessing on my side.

Maybe use Intel PresentMon as well to get more/better information about Frame Times, CPU/GPU wait etc. but processing it's captured data isn't really plug n play. It's at least noticeable that both your GPU & CPU utilization drop in the same time window. Msi afterburner can give you graphs with more details and a custom capture intervall.
 
There's a plugin from ShadowVenom that times stuff when loading a scene. This may help you find clues on what may be hurting your scene to load and work on.

A somewhat random suggestion: try removing the clothes and hair on the persons and see if the lags continue. Then try with a different hair/clothes and compare.
Hey there!!!:LOL:
I'm indeed paying attention to the loading time of the scene. Although it's not the focus of this question, thank you for your suggestion

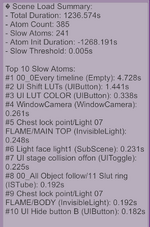
I have been using the SceneLoadLogger plugin of Shadow Venom for some time. It can indeed analyze the loading time of each atom in the scene, but it seems that it doesn't offer me much help in my scene.

What I'm currently optimizing is the SlutShow scene. The loading time of this scene has been bothering me a lot and also bothering all users o_O

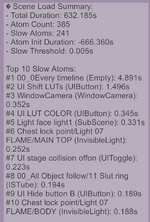
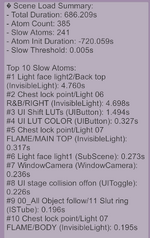
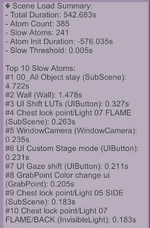
I used ai to calculate the SceneLoadLog files generated by four loading scenes for me, and calculated the total loading time of all atoms for me. On average, it was only about 20 seconds. So, focusing solely on time doesn't seem to be helpful.

Then ai analyze the atom with the longest relative loading time again. Indeed, I found that four atoms ranked relatively high in these four results. Among these four, two were predictable because they contained approximately 50+ plugins. The other two were a light atom and a sub-scene containing four or five basic shapes

I will continue to reduce the complexity of those over 50 plugins, which has always been my optimization direction. However, it's a pity that the SceneLoadLogger plugin didn't help me in the SlutShow scenario

The following are screenshots of the SceneLoadLogger plugin after loading these four scenes

屏幕截图 2025-08-02 091902.png屏幕截图 2025-08-02 093116.png屏幕截图 2025-08-02 094717.png屏幕截图 2025-08-02 101920.png
 
Depending on the scene, i randomly get short freezes every now and then as well.

It didn't bother me enough to investigate in depth but a few years back i believe i read something along the lines of memory leaks in plugins. Maybe that triggers some internal garbage collection or VAMs memory optimization? You could observe the Heap Size in the Performance 2 tab for a while. It shouldn't increase dramatically over time.

I'm not an expert, and my memories are vague, so it's more or less guessing on my side.

Maybe use Intel PresentMon as well to get more/better information about Frame Times, CPU/GPU wait etc. but processing it's captured data isn't really plug n play. It's at least noticeable that both your GPU & CPU utilization drop in the same time window. Msi afterburner can give you graphs with more details and a custom capture intervall.
Thank you for your suggestion!!

I'll download afterburner and then check the details:D
 
Depending on the scene, i randomly get short freezes every now and then as well.

It didn't bother me enough to investigate in depth but a few years back i believe i read something along the lines of memory leaks in plugins. Maybe that triggers some internal garbage collection or VAMs memory optimization? You could observe the Heap Size in the Performance 2 tab for a while. It shouldn't increase dramatically over time.

I'm not an expert, and my memories are vague, so it's more or less guessing on my side.

Maybe use Intel PresentMon as well to get more/better information about Frame Times, CPU/GPU wait etc. but processing it's captured data isn't really plug n play. It's at least noticeable that both your GPU & CPU utilization drop in the same time window. Msi afterburner can give you graphs with more details and a custom capture intervall.
Hey CV42, took your advice and ran MSI Afterburner during both Slutshow and Afterlife of an Angel sessions. Got the performance graphs captured just like you suggested
Did 15-minute passive runs on both scenes. You know what's weird? Slutshow's been choppier than usual today.... o_O

Here's the kicker: every metric I checked nosedives simultaneously during stutters. Can't tell if this is a GPU mutiny or CPU betrayal!
Thought it was thermal throttling at first, but get this - Afterlife of an Angel pushed the GPU 5°C hotter with zero hiccups.

VRAM usage looks identical twins-level similar. Got any idea?

test.jpg
 
Hey CV42, took your advice and ran MSI Afterburner during both Slutshow and Afterlife of an Angel sessions. Got the performance graphs captured just like you suggested
Did 15-minute passive runs on both scenes. You know what's weird? Slutshow's been choppier than usual today.... o_O

Here's the kicker: every metric I checked nosedives simultaneously during stutters. Can't tell if this is a GPU mutiny or CPU betrayal!
Thought it was thermal throttling at first, but get this - Afterlife of an Angel pushed the GPU 5°C hotter with zero hiccups.

VRAM usage looks identical twins-level similar. Got any idea?
You can sort and disable unnescessary graphs in afterburner to make it easier to compare stuff.

Hardware performance doesn't seem to be the problem. My best bet is still plugins. I would remove as many as possible in the Slutshow scene and see how the scene behaves then, especially the GPU utilization. Should be enough to let it run just a few minutes. If there are a lot of plugins, you can remove them by editing a copy of the scene.json.

Also worth a try disabling the environment. I came across a few environments that tank my performance for no apparent reason.
Thanks a ton for the detailed guidance — really appreciate you taking the time! 🫡

Yes, I will start disabling some plugins for testing. I think too many plugins are the cause of the problem
Just when the scene was running, there was only one lag on average every five minutes, which was very odd...

Quick clarification on the environment point: when you say "disabling the environment", could you specify which components to target? Do u mean Postmagic? When the lag occurred, I indeed didn't activate any post-rendering effects in the postmagic plugin
 
Quick clarification on the environment point: when you say "disabling the environment", could you specify which components to target? Do u mean Postmagic? When the lag occurred, I indeed didn't activate any post-rendering effects in the postmagic plugin
I mean the actual environment CUA in which the scene takes place. You may want to observe the performance with the CUA disabled for testing purposes.
 
I mean the actual environment CUA in which the scene takes place. You may want to observe the performance with the CUA disabled for testing purposes.
Got it — thanks for clarifying!
 
Back
Top Bottom